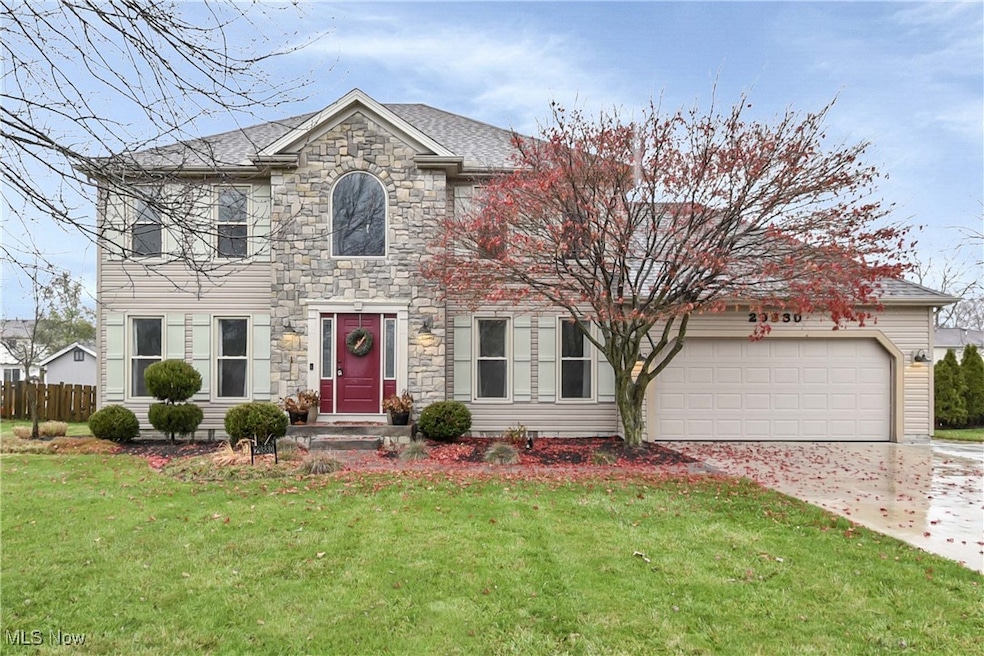
29880 Westminster Dr North Olmsted, OH 44070
Estimated payment $2,637/month
Highlights
- Colonial Architecture
- Deck
- No HOA
- North Olmsted Middle School Rated 9+
- 1 Fireplace
- Porch
About This Home
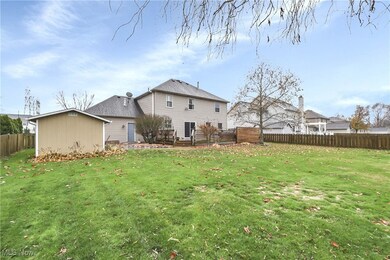
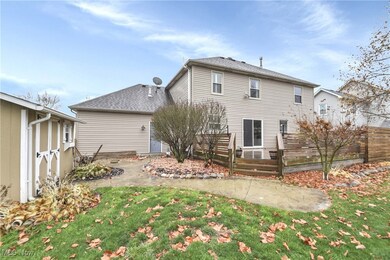
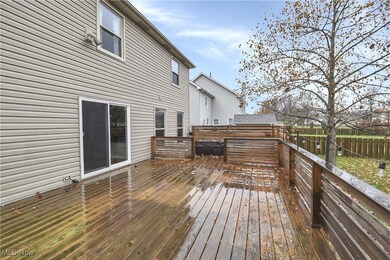
Beautifully Updated 4-Bedroom Home is Offered at 439,900
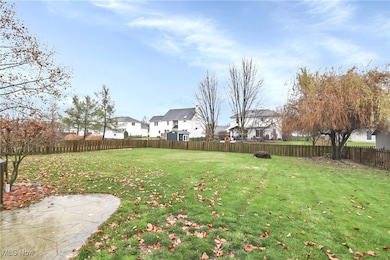
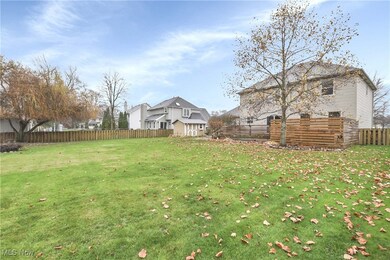
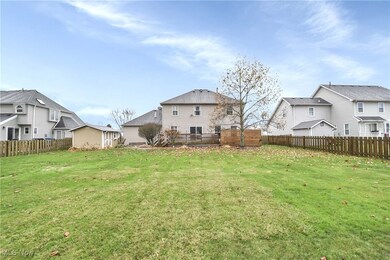
Welcome to this warm and inviting 4-bedroom, 2.5-bath home, perfectly designed for comfortable living and modern convenience. Located in a wonderful neighborhood known for its great atmosphere this home offers the ideal blend of community and comfort. Step inside to find tasteful updates throughout, offering a clean, move-in-ready feel. The main level features bright living spaces and a functional layout perfect for both everyday living and entertaining. Head downstairs to the partially finished basement, offering extra space for a playroom, home office, gym, or media room—whatever fits your lifestyle. Out back, enjoy your own personal oasis with a spacious deck and relaxing new hot tub, overlooking a fully fenced backyard that provides privacy, security, and plenty of room.
With its thoughtful updates, flexible layout, and unbeatable location, this home is a rare find. Come see why you will love this neighborhood—you may never want to leave!
Listing Agent
Trelora Realty, Inc. Brokerage Email: 513-643-0266, ironwoodgroup@trelora.com License #2024000468 Listed on: 12/09/2025
Home Details
Home Type
- Single Family
Est. Annual Taxes
- $3,958
Year Built
- Built in 1993 | Remodeled
Parking
- 1 Car Garage
- Driveway
Home Design
- Colonial Architecture
- Frame Construction
- Asphalt Roof
Interior Spaces
- 2,208 Sq Ft Home
- 2-Story Property
- Ceiling Fan
- 1 Fireplace
- Blinds
- Fire and Smoke Detector
- Partially Finished Basement
Kitchen
- Range
- Microwave
- Dishwasher
Bedrooms and Bathrooms
- 4 Bedrooms
- Walk-In Closet
- 2.5 Bathrooms
Outdoor Features
- Deck
- Porch
Additional Features
- 0.3 Acre Lot
- Central Air
Community Details
- No Home Owners Association
- Cambridge Crossings Estates Subdivision
Listing and Financial Details
- Assessor Parcel Number 234-18-116
Map
Home Values in the Area
Average Home Value in this Area
Tax History
| Year | Tax Paid | Tax Assessment Tax Assessment Total Assessment is a certain percentage of the fair market value that is determined by local assessors to be the total taxable value of land and additions on the property. | Land | Improvement |
|---|---|---|---|---|
| 2024 | $7,915 | $115,500 | $25,760 | $89,740 |
| 2023 | $6,818 | $83,480 | $21,980 | $61,500 |
| 2022 | $6,782 | $83,475 | $21,980 | $61,495 |
| 2021 | $6,138 | $83,480 | $21,980 | $61,500 |
| 2020 | $6,189 | $74,550 | $19,640 | $54,920 |
| 2019 | $6,023 | $213,000 | $56,100 | $156,900 |
| 2018 | $6,056 | $74,550 | $19,640 | $54,920 |
| 2017 | $6,106 | $68,610 | $13,900 | $54,710 |
| 2016 | $6,053 | $68,610 | $13,900 | $54,710 |
| 2015 | $6,058 | $68,610 | $13,900 | $54,710 |
| 2014 | $6,058 | $66,610 | $13,480 | $53,130 |
Property History
| Date | Event | Price | List to Sale | Price per Sq Ft |
|---|---|---|---|---|
| 12/09/2025 12/09/25 | For Sale | $439,900 | -- | $199 / Sq Ft |
Purchase History
| Date | Type | Sale Price | Title Company |
|---|---|---|---|
| Interfamily Deed Transfer | -- | Patriot Land Title Ii | |
| Warranty Deed | $216,000 | Commonwealth Land Title Insu | |
| Deed | $209,000 | -- | |
| Deed | $193,400 | -- | |
| Deed | $42,000 | -- | |
| Deed | -- | -- |
Mortgage History
| Date | Status | Loan Amount | Loan Type |
|---|---|---|---|
| Open | $209,500 | No Value Available | |
| Previous Owner | $159,000 | New Conventional |
Source: MLS Now
MLS Number: 5176194
APN: 234-18-116
Disclaimer: Certain information contained herein is derived from information provided by parties other than Homes.com. All information provided is deemed reliable, but is not guaranteed to be accurate and should be independently verified.
![]() IDX information is provided exclusively for personal, non-commercial use, and may not be used for any purpose other than to identify prospective properties consumers may be interested in purchasing. Information is deemed reliable but not guaranteed.
IDX information is provided exclusively for personal, non-commercial use, and may not be used for any purpose other than to identify prospective properties consumers may be interested in purchasing. Information is deemed reliable but not guaranteed.
- 29861 Wellington Dr
- 29651 Westminster Dr
- 6979 Warrington Dr
- 29695 Bretton Ridge Dr
- 27097 Oakwood Cir Unit 208Z
- 7097 Stearns Rd
- 30251 Ginger Ln Unit 53A
- 27069 Oakwood Cir Unit 117W
- 6752 Cypress Dr
- 30651 Jasmine Ct Unit 58B
- 27261 Cook Rd
- 30621 Iris Ct Unit 31A
- 30630 Lorain Rd
- 30646 Lorain Rd
- 27259 Cook Rd
- 28628 Aspen Dr
- 0 Stearns Rd
- 31134 Lorain Rd
- 6926 Mackenzie Rd
- 7200 Lilac Ct Unit 4A
- 27080 Oakwood Dr
- 5938 Porter Rd
- 8300 Ira Dr
- 8600 Evergreen Trail
- 6509-6520 Pitts Blvd
- 5264 Victoria Ln
- 26101 Country Club Blvd
- 25801 Country Club Blvd
- 5800 Great Northern Blvd
- 4351 Dover Center Rd Unit North
- 35140 Mildred St
- 6001-6005 Jaycox Rd
- 8555 Spencer Ct
- 25735 Lorain Rd Unit 18
- 25735 Lorain Rd Unit 219
- 9640 Fernwood Dr
- 25151 Brookpark Rd
- 24851 Country Club Blvd
- 5250 Columbia Rd
- 27279 Dunford Rd
