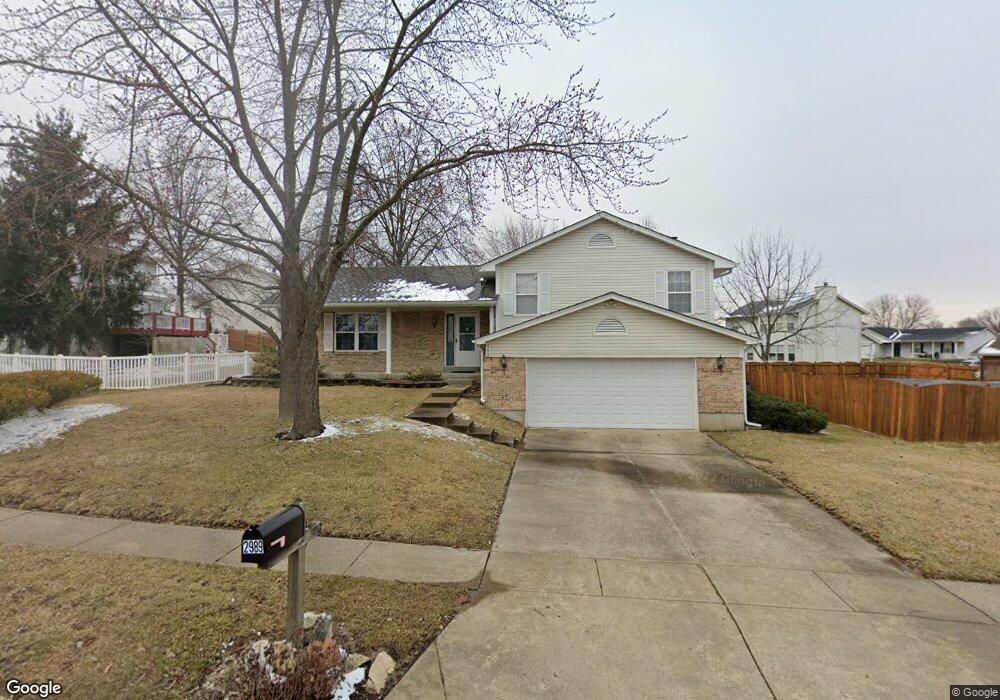
2989 Wheatfield Farms Dr O Fallon, MO 63368
Estimated Value: $302,000 - $313,000
3
Beds
2
Baths
1,294
Sq Ft
$236/Sq Ft
Est. Value
About This Home
This home is located at 2989 Wheatfield Farms Dr, O Fallon, MO 63368 and is currently estimated at $305,493, approximately $236 per square foot. 2989 Wheatfield Farms Dr is a home located in St. Charles County with nearby schools including Pheasant Point Elementary School, Fort Zumwalt South Middle School, and Fort Zumwalt South High School.
Ownership History
Date
Name
Owned For
Owner Type
Purchase Details
Closed on
Sep 13, 2021
Sold by
Balestreri Susan J and Bogard Mark
Bought by
Balestreri Susan J
Current Estimated Value
Purchase Details
Closed on
Dec 3, 1997
Sold by
Michel Charles E and Michel Susan N
Bought by
Bogard Dorthy H
Home Financials for this Owner
Home Financials are based on the most recent Mortgage that was taken out on this home.
Original Mortgage
$40,000
Outstanding Balance
$6,749
Interest Rate
7.2%
Estimated Equity
$298,744
Purchase Details
Closed on
Dec 30, 1996
Sold by
Loesch William D and Loesch William D
Bought by
Michel Charles E and Michel Susan N
Home Financials for this Owner
Home Financials are based on the most recent Mortgage that was taken out on this home.
Original Mortgage
$98,300
Interest Rate
7.43%
Purchase Details
Closed on
Dec 9, 1996
Sold by
Loesch Sara A
Bought by
Loesch William Davidson
Home Financials for this Owner
Home Financials are based on the most recent Mortgage that was taken out on this home.
Original Mortgage
$98,300
Interest Rate
7.43%
Create a Home Valuation Report for This Property
The Home Valuation Report is an in-depth analysis detailing your home's value as well as a comparison with similar homes in the area
Home Values in the Area
Average Home Value in this Area
Purchase History
| Date | Buyer | Sale Price | Title Company |
|---|---|---|---|
| Balestreri Susan J | -- | None Available | |
| Bogard Dorthy H | $106,000 | -- | |
| Michel Charles E | -- | -- | |
| Loesch William Davidson | -- | -- |
Source: Public Records
Mortgage History
| Date | Status | Borrower | Loan Amount |
|---|---|---|---|
| Open | Bogard Dorthy H | $40,000 | |
| Previous Owner | Michel Charles E | $98,300 |
Source: Public Records
Tax History Compared to Growth
Tax History
| Year | Tax Paid | Tax Assessment Tax Assessment Total Assessment is a certain percentage of the fair market value that is determined by local assessors to be the total taxable value of land and additions on the property. | Land | Improvement |
|---|---|---|---|---|
| 2025 | $2,918 | $49,028 | -- | -- |
| 2023 | $2,921 | $44,166 | $0 | $0 |
| 2022 | $2,695 | $37,968 | $0 | $0 |
| 2021 | $2,701 | $37,968 | $0 | $0 |
| 2020 | $2,488 | $33,651 | $0 | $0 |
| 2019 | $2,494 | $33,651 | $0 | $0 |
| 2018 | $2,331 | $30,069 | $0 | $0 |
| 2017 | $2,290 | $30,069 | $0 | $0 |
| 2016 | $2,138 | $26,966 | $0 | $0 |
| 2015 | $1,993 | $26,966 | $0 | $0 |
| 2014 | $1,966 | $26,238 | $0 | $0 |
Source: Public Records
Map
Nearby Homes
- 6355 Sprucefield Dr
- 817 Brimley Dr
- 1218 Cold Spring Dr
- 1228 Cold Spring Dr
- 201 Dardenne Farms Dr
- 691 Logan Valley Dr
- 661 Clifton Hill Dr
- 60 Loganberry Ct
- 28 Tailor Ct
- 421 Jacobs Place Dr
- 225 Jacobs Way
- 1 Pauley Cir
- 212 Jacobs Way
- 1412 Colonial Dr
- 1313 Commons Cir
- 1406 Colonial Dr
- 202 Sunshine Dr
- 9113 Camino Trail
- 213 Black Oak Dr
- 8019 Cotswald Trail
- 6401 Sprucefield Dr
- 6402 High Meadow Dr
- 6404 High Meadow Dr
- 6405 Sprucefield Dr
- 6408 High Meadow Dr
- 6409 Sprucefield Dr
- 6363 Sprucefield Dr
- 2992 Wheatfield Farms Dr
- 6410 High Meadow Dr
- 6400 Sprucefield Dr
- 2984 Wheatfield Farms Dr
- 6413 Sprucefield Dr
- 6401 High Meadow Dr
- 6404 Sprucefield Dr
- 6359 Sprucefield Dr
- 6403 High Meadow Dr
- 2980 Wheatfield Farms Dr
- 6407 High Meadow Dr
- 6408 Sprucefield Dr
- 2976 Wheatfield Farms Dr