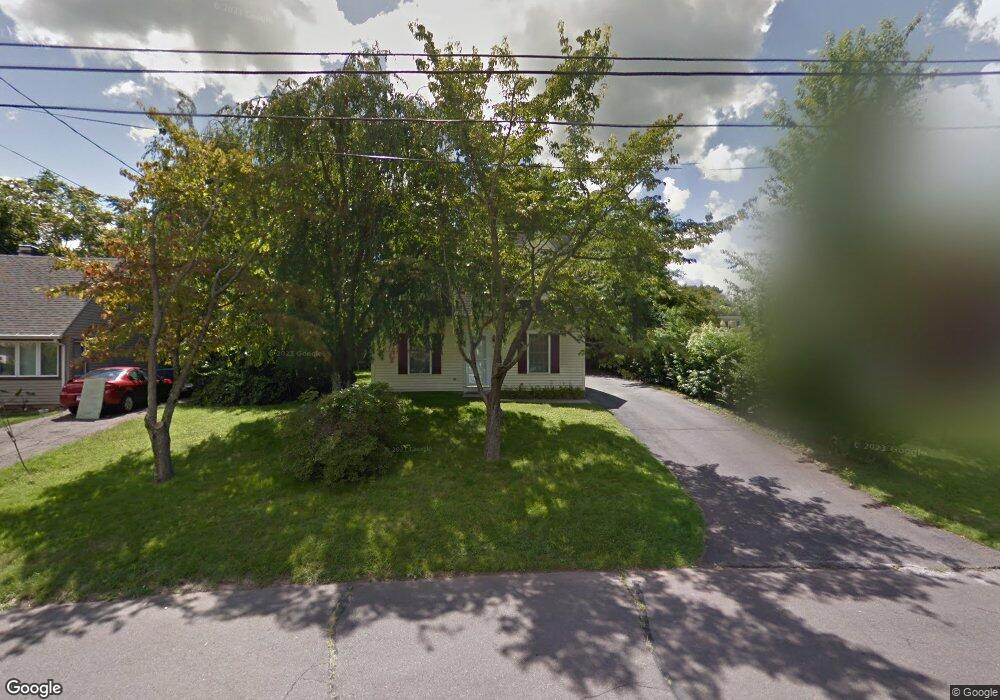
299 Glen Hills Rd Meriden, CT 06451
South Meriden NeighborhoodEstimated Value: $326,000 - $432,000
3
Beds
2
Baths
1,498
Sq Ft
$243/Sq Ft
Est. Value
About This Home
This home is located at 299 Glen Hills Rd, Meriden, CT 06451 and is currently estimated at $363,321, approximately $242 per square foot. 299 Glen Hills Rd is a home located in New Haven County with nearby schools including Hanover School, Lincoln Middle School, and Orville H. Platt High School.
Ownership History
Date
Name
Owned For
Owner Type
Purchase Details
Closed on
Aug 13, 2022
Sold by
Johnson David and Johnson Rebecca
Bought by
Johnson Rebecca
Current Estimated Value
Purchase Details
Closed on
Jan 23, 2007
Sold by
Dennis-Hall Ebony and Hall Kenyatta
Bought by
Johnson David and Johnson Rebecca
Home Financials for this Owner
Home Financials are based on the most recent Mortgage that was taken out on this home.
Original Mortgage
$176,000
Interest Rate
6.14%
Purchase Details
Closed on
Aug 2, 2004
Sold by
Cassella Peter P and Monaco Dave
Bought by
Hall Ebohy Dennis and Hall Kenyatta
Purchase Details
Closed on
Mar 2, 2004
Sold by
Barberino David P and Barberino Donald P
Bought by
Cassella Peter P and Monaco Dave
Purchase Details
Closed on
Oct 31, 2003
Sold by
Koralo Thomas and Koralo Jamieson
Bought by
Barberino David P and Barberino Donald P
Create a Home Valuation Report for This Property
The Home Valuation Report is an in-depth analysis detailing your home's value as well as a comparison with similar homes in the area
Home Values in the Area
Average Home Value in this Area
Purchase History
| Date | Buyer | Sale Price | Title Company |
|---|---|---|---|
| Johnson Rebecca | -- | None Available | |
| Johnson David | $220,000 | -- | |
| Hall Ebohy Dennis | $175,000 | -- | |
| Cassella Peter P | $30,000 | -- | |
| Barberino David P | $24,000 | -- |
Source: Public Records
Mortgage History
| Date | Status | Borrower | Loan Amount |
|---|---|---|---|
| Previous Owner | Barberino David P | $176,000 | |
| Previous Owner | Barberino David P | $22,000 |
Source: Public Records
Tax History Compared to Growth
Tax History
| Year | Tax Paid | Tax Assessment Tax Assessment Total Assessment is a certain percentage of the fair market value that is determined by local assessors to be the total taxable value of land and additions on the property. | Land | Improvement |
|---|---|---|---|---|
| 2024 | $5,909 | $162,750 | $45,920 | $116,830 |
| 2023 | $5,662 | $162,750 | $45,920 | $116,830 |
| 2022 | $5,369 | $162,750 | $45,920 | $116,830 |
| 2021 | $5,211 | $127,540 | $40,880 | $86,660 |
| 2020 | $5,211 | $127,540 | $40,880 | $86,660 |
| 2019 | $5,214 | $127,610 | $40,950 | $86,660 |
| 2018 | $5,237 | $127,610 | $40,950 | $86,660 |
| 2017 | $5,094 | $127,610 | $40,950 | $86,660 |
| 2016 | $4,613 | $125,930 | $31,780 | $94,150 |
| 2015 | $4,613 | $125,930 | $31,780 | $94,150 |
| 2014 | $4,501 | $125,930 | $31,780 | $94,150 |
Source: Public Records
Map
Nearby Homes
- 350 Glen Hills Rd
- 176 Hancock St
- 3 Washington Ave
- 171 Oregon Rd
- 55 Peacock Dr
- 187 Oregon Rd
- 42 Peacock Dr
- 281 Oregon Rd
- 53 Hobson Ave
- 24 Harrington St
- 127 Lambert Ave
- 146 Lambert Ave
- 58 Baldwin St
- 16 Park Place
- 36 Winthrop Terrace
- 342 Columbus Ave
- 127 Winthrop Terrace
- 123 Allen Ave
- 177 Parkview St
- 14 Mosher St
- 305 Glen Hills Rd
- 293 Glen Hills Rd
- 95 Glen Hills Rd
- 91 Glen Hills Rd
- 311 Glen Hills Rd
- 13 Terrace Ln
- 291 Glen Hills Rd
- 85 Glen Hills Rd
- 3 Terrace Ln
- 17 Terrace Ln
- 79 Glen Hills Rd
- 317 Glen Hills Rd
- 296 Glen Hills Rd
- 292 Glen Hills Rd
- 25 Terrace Ln
- 289 Glen Hills Rd
- 302 Glen Hills Rd
- 308 Glen Hills Rd
- 73 Glen Hills Rd
- 33 Terrace Ln