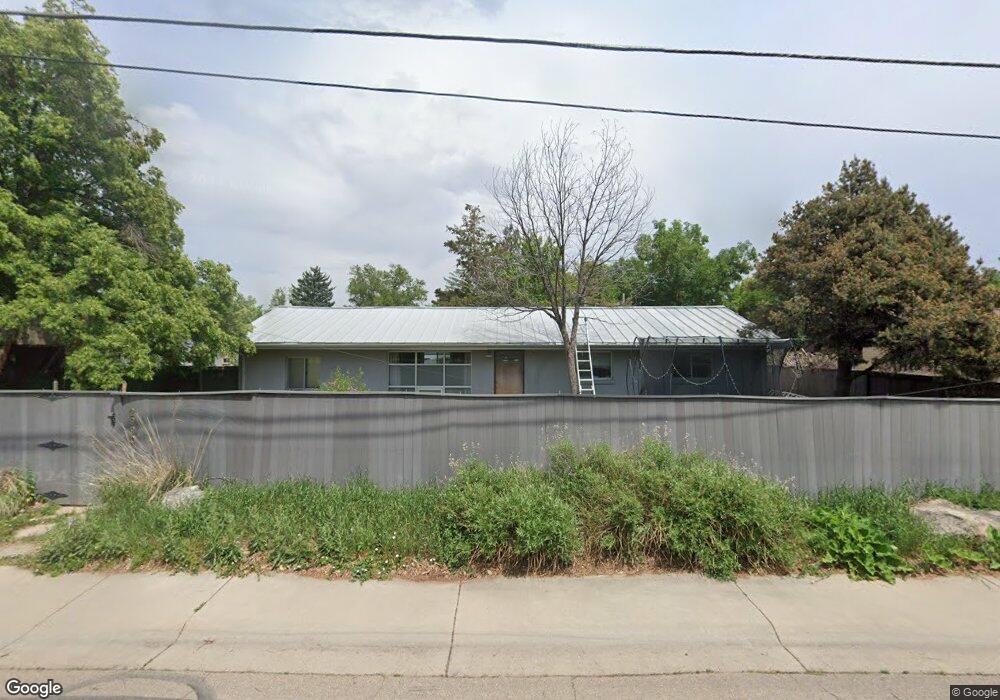
2990 19th St Boulder, CO 80304
Central Boulder NeighborhoodEstimated Value: $1,107,000 - $1,361,000
4
Beds
2
Baths
1,375
Sq Ft
$910/Sq Ft
Est. Value
About This Home
This home is located at 2990 19th St, Boulder, CO 80304 and is currently estimated at $1,251,256, approximately $910 per square foot. 2990 19th St is a home located in Boulder County with nearby schools including Columbine Elementary School, Casey Middle School, and Boulder High School.
Ownership History
Date
Name
Owned For
Owner Type
Purchase Details
Closed on
Nov 21, 2017
Sold by
Grano Jill Adler
Bought by
Grano Jordan Taft
Current Estimated Value
Purchase Details
Closed on
Jun 20, 2007
Sold by
Gonya Gary and Bernoski Mariana
Bought by
Grano Jordan Taft
Home Financials for this Owner
Home Financials are based on the most recent Mortgage that was taken out on this home.
Original Mortgage
$195,000
Outstanding Balance
$119,125
Interest Rate
6.16%
Mortgage Type
Unknown
Estimated Equity
$1,132,131
Purchase Details
Closed on
May 30, 2006
Sold by
Brown Travis and Monroe Mary R
Bought by
Gonya Gary
Home Financials for this Owner
Home Financials are based on the most recent Mortgage that was taken out on this home.
Original Mortgage
$400,000
Interest Rate
6.5%
Mortgage Type
Fannie Mae Freddie Mac
Purchase Details
Closed on
Jul 28, 2004
Sold by
Brown Travis
Bought by
Brown Travis
Home Financials for this Owner
Home Financials are based on the most recent Mortgage that was taken out on this home.
Original Mortgage
$359,000
Interest Rate
6.3%
Mortgage Type
New Conventional
Purchase Details
Closed on
Nov 2, 1998
Sold by
Murray Jon S and Dossett Jennifer D
Bought by
Brown Travis
Home Financials for this Owner
Home Financials are based on the most recent Mortgage that was taken out on this home.
Original Mortgage
$162,400
Interest Rate
6.57%
Purchase Details
Closed on
Apr 1, 1992
Bought by
Grano Jordan Taft and Grano Jill Adler
Purchase Details
Closed on
Jun 16, 1987
Bought by
Grano Jordan Taft and Grano Jill Adler
Create a Home Valuation Report for This Property
The Home Valuation Report is an in-depth analysis detailing your home's value as well as a comparison with similar homes in the area
Home Values in the Area
Average Home Value in this Area
Purchase History
| Date | Buyer | Sale Price | Title Company |
|---|---|---|---|
| Grano Jordan Taft | -- | None Available | |
| Grano Jordan Taft | $520,000 | Land Title | |
| Gonya Gary | $500,000 | Land Title | |
| Brown Travis | -- | -- | |
| Brown Travis | $203,000 | -- | |
| Grano Jordan Taft | $115,000 | -- | |
| Grano Jordan Taft | $89,900 | -- | |
| Grano Jordan Taft | -- | -- |
Source: Public Records
Mortgage History
| Date | Status | Borrower | Loan Amount |
|---|---|---|---|
| Open | Grano Jordan Taft | $195,000 | |
| Previous Owner | Gonya Gary | $400,000 | |
| Previous Owner | Brown Travis | $359,000 | |
| Previous Owner | Brown Travis | $162,400 |
Source: Public Records
Tax History
| Year | Tax Paid | Tax Assessment Tax Assessment Total Assessment is a certain percentage of the fair market value that is determined by local assessors to be the total taxable value of land and additions on the property. | Land | Improvement |
|---|---|---|---|---|
| 2025 | $8,195 | $81,200 | $57,100 | $24,100 |
| 2024 | $8,195 | $81,200 | $57,100 | $24,100 |
| 2023 | $8,053 | $93,251 | $59,241 | $37,694 |
| 2022 | $6,788 | $73,100 | $45,182 | $27,918 |
| 2021 | $6,473 | $75,204 | $46,482 | $28,722 |
| 2020 | $5,545 | $63,707 | $50,837 | $12,870 |
| 2019 | $5,461 | $63,707 | $50,837 | $12,870 |
| 2018 | $4,972 | $57,348 | $38,304 | $19,044 |
| 2017 | $4,816 | $63,401 | $42,347 | $21,054 |
| 2016 | $4,551 | $52,576 | $39,959 | $12,617 |
| 2015 | $4,310 | $44,879 | $20,537 | $24,342 |
| 2014 | $3,773 | $44,879 | $20,537 | $24,342 |
Source: Public Records
Map
Nearby Homes
- 3150 18th St
- 3150 19th St
- 2965 17th St
- 1805 Forest Ave
- 3275 19th St
- 2870 18th St
- 3010 14th St
- 1930 Grape Ave
- 3055 23rd St
- 1412 Elder Ave
- 2003 Balsam Dr
- 2901 Lorraine Ct
- 2085 Balsam Dr
- 1895 Alpine Ave Unit G22
- 1895 Alpine Ave Unit G21
- 1895 Alpine Ave Unit E18
- 2315 Forest Ave
- 1749 Alpine Ave Unit 10
- 3125 Fremont St
- 2025 Hermosa Dr
Your Personal Tour Guide
Ask me questions while you tour the home.