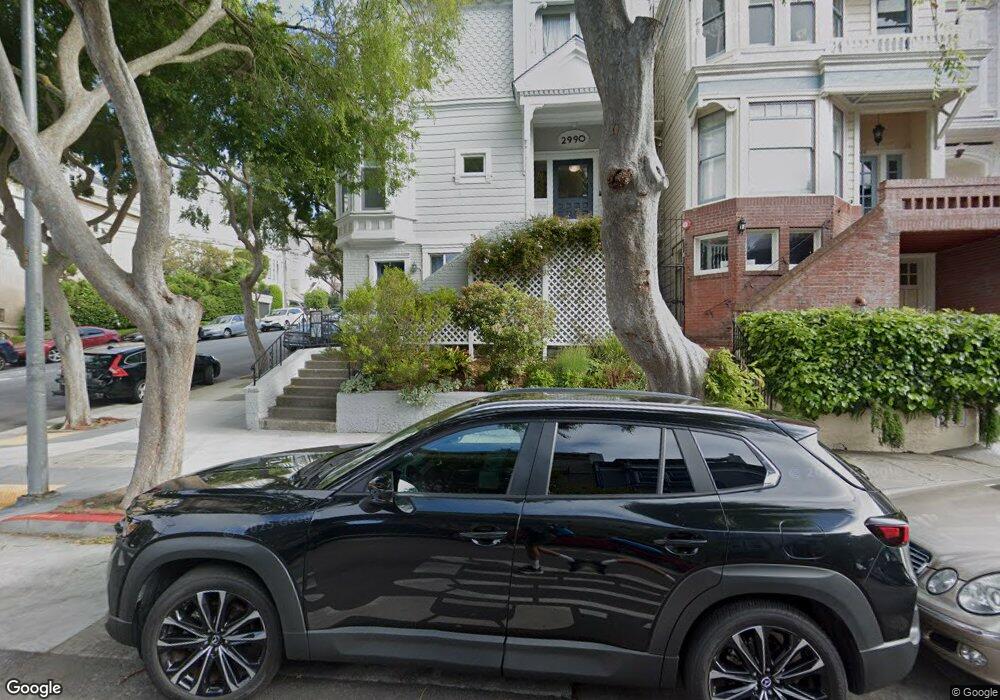
2990 Clay St Unit 2 San Francisco, CA 94115
Pacific Heights NeighborhoodEstimated Value: $1,887,000 - $2,174,000
2
Beds
2
Baths
1,375
Sq Ft
$1,446/Sq Ft
Est. Value
About This Home
This home is located at 2990 Clay St Unit 2, San Francisco, CA 94115 and is currently estimated at $1,987,815, approximately $1,445 per square foot. 2990 Clay St Unit 2 is a home located in San Francisco County with nearby schools including Cobb (William L.) Elementary School, Roosevelt Middle School, and San Francisco Waldorf School.
Ownership History
Date
Name
Owned For
Owner Type
Purchase Details
Closed on
May 2, 2018
Sold by
Zahedi Sebastian
Bought by
Zahedi Sebastian R and The Zahedi Revocable Trust
Current Estimated Value
Purchase Details
Closed on
Apr 22, 2014
Sold by
Imlay Peter J
Bought by
Zahedi Sebastian
Home Financials for this Owner
Home Financials are based on the most recent Mortgage that was taken out on this home.
Original Mortgage
$1,260,000
Outstanding Balance
$883,235
Interest Rate
2.4%
Mortgage Type
Adjustable Rate Mortgage/ARM
Estimated Equity
$1,104,580
Purchase Details
Closed on
Aug 8, 2002
Sold by
Salamon Tracy and Salamon Michael
Bought by
Imlay Peter J
Home Financials for this Owner
Home Financials are based on the most recent Mortgage that was taken out on this home.
Original Mortgage
$964,000
Interest Rate
5.4%
Purchase Details
Closed on
Apr 26, 1999
Sold by
Lowenberg Susan E
Bought by
Potter Catherine T
Create a Home Valuation Report for This Property
The Home Valuation Report is an in-depth analysis detailing your home's value as well as a comparison with similar homes in the area
Home Values in the Area
Average Home Value in this Area
Purchase History
| Date | Buyer | Sale Price | Title Company |
|---|---|---|---|
| Zahedi Sebastian R | -- | None Available | |
| Zahedi Sebastian | $2,075,000 | First American Title Company | |
| Imlay Peter J | $1,205,000 | Chicago Title Co | |
| Potter Catherine T | $885,000 | Fidelity National Title Co |
Source: Public Records
Mortgage History
| Date | Status | Borrower | Loan Amount |
|---|---|---|---|
| Open | Zahedi Sebastian | $1,260,000 | |
| Previous Owner | Imlay Peter J | $964,000 |
Source: Public Records
Tax History Compared to Growth
Tax History
| Year | Tax Paid | Tax Assessment Tax Assessment Total Assessment is a certain percentage of the fair market value that is determined by local assessors to be the total taxable value of land and additions on the property. | Land | Improvement |
|---|---|---|---|---|
| 2025 | $27,121 | $2,281,596 | $1,368,958 | $912,638 |
| 2024 | $27,121 | $2,236,860 | $1,342,116 | $894,744 |
| 2023 | $26,687 | $2,193,000 | $1,315,800 | $877,200 |
| 2022 | $24,999 | $2,050,000 | $1,025,000 | $1,025,000 |
| 2021 | $29,213 | $2,403,242 | $1,174,974 | $1,228,268 |
| 2020 | $29,378 | $2,378,602 | $1,162,927 | $1,215,675 |
| 2019 | $28,372 | $2,331,964 | $1,140,125 | $1,191,839 |
| 2018 | $27,369 | $2,286,240 | $1,117,770 | $1,168,470 |
| 2017 | $26,749 | $2,241,412 | $1,095,853 | $1,145,559 |
| 2016 | $25,771 | $2,148,732 | $1,074,366 | $1,074,366 |
| 2015 | $25,456 | $2,116,458 | $1,058,229 | $1,058,229 |
| 2014 | $17,056 | $1,423,682 | $711,841 | $711,841 |
Source: Public Records
Map
Nearby Homes
- 2121 Divisadero St
- 2850 Jackson St
- 2033 Broderick St
- 2025 Broderick St Unit 6
- 2221 Scott St
- 2046 Divisadero St
- 2990 Jackson St Unit 4
- 2800 Pacific Ave
- 2830 Pacific Ave
- 2051 Scott St Unit 101
- 3124 Washington St
- 2725 Broadway St
- 2829 California St Unit 2
- 2735 Clay St Unit 1
- 2898 Broadway St
- 2833 Vallejo St
- 1819 Lyon St Unit 3
- 1819 Lyon St Unit 1
- 2825 Pine St
- 2546 Jackson St
- 2990 Clay St
- 2990 Clay St Unit 4
- 2990 Clay St Unit 3
- 2990 Clay St Unit 1
- 2978 Clay St
- 2122 Broderick St
- 2105 Broderick St Unit 2105
- 2974 Clay St
- 2101 Broderick St
- 3004 Clay St
- 3002 Clay St Unit A
- 3002 Clay St
- 3002A Clay St Unit 3002A
- 2136 Broderick St
- 2985 Clay St Unit 2987
- 3006 Clay St
- 2109 Broderick St
- 2111 Broderick St
- 2144 Broderick St
- 2142 Broderick St Unit 2142