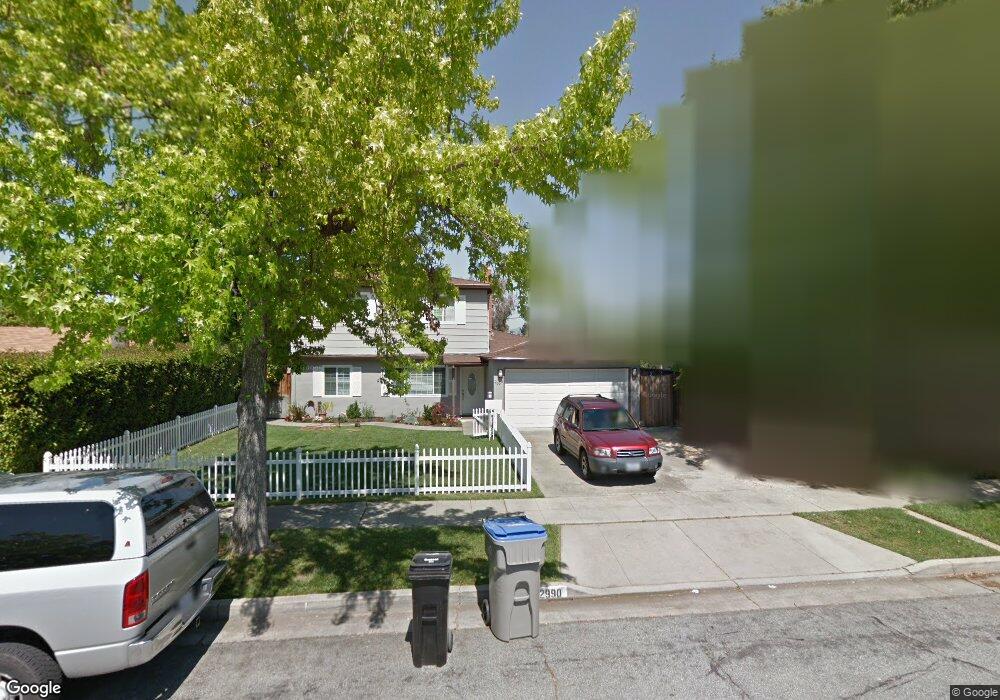
2990 Kilo Ave San Jose, CA 95124
Doerr-Steindorf NeighborhoodEstimated Value: $1,709,000 - $2,026,000
4
Beds
4
Baths
1,877
Sq Ft
$1,014/Sq Ft
Est. Value
About This Home
This home is located at 2990 Kilo Ave, San Jose, CA 95124 and is currently estimated at $1,903,834, approximately $1,014 per square foot. 2990 Kilo Ave is a home located in Santa Clara County with nearby schools including Branham High School, Fammatre Elementary School, and Sartorette Charter School.
Ownership History
Date
Name
Owned For
Owner Type
Purchase Details
Closed on
Jul 13, 2007
Sold by
Kim George and Seung Young Joo
Bought by
Schwartz Lisa L and Schwartz Thomas M
Current Estimated Value
Home Financials for this Owner
Home Financials are based on the most recent Mortgage that was taken out on this home.
Original Mortgage
$100,000
Interest Rate
6.73%
Mortgage Type
Unknown
Purchase Details
Closed on
Jun 14, 2005
Sold by
Hwang Hosung and Kim George
Bought by
Kim George and Seung Young Joo
Purchase Details
Closed on
Apr 14, 2005
Sold by
Seung Youong Joo
Bought by
Kim George
Home Financials for this Owner
Home Financials are based on the most recent Mortgage that was taken out on this home.
Original Mortgage
$507,750
Interest Rate
4.54%
Mortgage Type
Purchase Money Mortgage
Purchase Details
Closed on
Jul 12, 2000
Sold by
Ney Richard R and Ney Michon L
Bought by
Kubica Andrew
Home Financials for this Owner
Home Financials are based on the most recent Mortgage that was taken out on this home.
Original Mortgage
$319,200
Interest Rate
8.87%
Create a Home Valuation Report for This Property
The Home Valuation Report is an in-depth analysis detailing your home's value as well as a comparison with similar homes in the area
Home Values in the Area
Average Home Value in this Area
Purchase History
| Date | Buyer | Sale Price | Title Company |
|---|---|---|---|
| Schwartz Lisa L | $689,000 | Alliance Title Company | |
| Kim George | -- | -- | |
| Kim George | -- | Chicago Title | |
| Hwang Hosung | -- | Chicago Title | |
| Hwang Hosung | $677,000 | Chicago Title | |
| Kubica Andrew | $399,000 | Old Republic Title Company |
Source: Public Records
Mortgage History
| Date | Status | Borrower | Loan Amount |
|---|---|---|---|
| Closed | Schwartz Lisa L | $100,000 | |
| Open | Schwartz Lisa L | $551,200 | |
| Previous Owner | Hwang Hosung | $507,750 | |
| Previous Owner | Kubica Andrew | $319,200 | |
| Closed | Kubica Andrew | $79,800 | |
| Closed | Hwang Hosung | $101,550 |
Source: Public Records
Tax History
| Year | Tax Paid | Tax Assessment Tax Assessment Total Assessment is a certain percentage of the fair market value that is determined by local assessors to be the total taxable value of land and additions on the property. | Land | Improvement |
|---|---|---|---|---|
| 2025 | $13,249 | $985,100 | $656,752 | $328,348 |
| 2024 | $13,249 | $965,785 | $643,875 | $321,910 |
| 2023 | $13,156 | $946,849 | $631,250 | $315,599 |
| 2022 | $12,922 | $928,284 | $618,873 | $309,411 |
| 2021 | $12,306 | $880,484 | $606,739 | $273,745 |
| 2020 | $11,227 | $827,512 | $600,518 | $226,994 |
| 2019 | $11,087 | $811,288 | $588,744 | $222,544 |
| 2018 | $10,783 | $795,381 | $577,200 | $218,181 |
| 2017 | $10,577 | $779,786 | $565,883 | $213,903 |
| 2016 | $10,074 | $764,497 | $554,788 | $209,709 |
| 2015 | $9,953 | $753,014 | $546,455 | $206,559 |
| 2014 | $9,376 | $738,264 | $535,751 | $202,513 |
Source: Public Records
Map
Nearby Homes
- 2872 Manda Dr
- 1743 Willow Creek Ct
- 1779 Foxworthy Ave
- 1775 Wema Way
- 2823 Quinto Way
- 1795 Foxworthy Ave
- 3210 Rama Dr
- 1695 Grizilo Dr
- 1792 Potrero Dr
- 2881 Meridian Ave Unit 104
- 2881 Meridian Ave Unit 234
- 2881 Meridian Ave Unit 217
- 1658 N Pole Place Unit 1
- 2812 Paseo Ln Unit 2812
- 2806 Paseo Ln
- 2788 Lexford Ave
- 2643 Hill Park Dr
- 2915 Ross Ave
- 1653 Hillsdale Ave Unit 4
- 3678 Julio Ave
- 2976 Kilo Ave
- 1745 Foxworthy Ave
- 2989 Julio Ave
- 2975 Julio Ave
- 2962 Kilo Ave
- 2995 Julio Ave
- 2961 Julio Ave
- 1751 Foxworthy Ave
- 2985 Kilo Ave
- 2948 Kilo Ave
- 2971 Kilo Ave
- 1740 Foxworthy Ave
- 2947 Julio Ave
- 2957 Kilo Ave
- 1746 Foxworthy Ave
- 1736 Foxworthy Ave
- 2934 Kilo Ave
- 3016 Kilo Ave
- 2943 Kilo Ave
- 1755 Foxworthy Ave
Your Personal Tour Guide
Ask me questions while you tour the home.