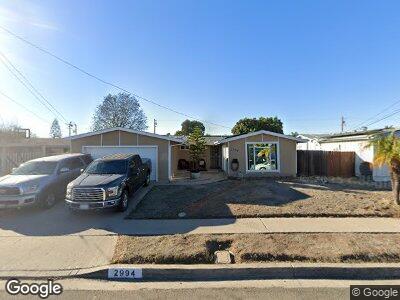
2994 Cabrillo Mesa Dr San Diego, CA 92123
Serra Mesa NeighborhoodEstimated Value: $777,000 - $1,062,606
3
Beds
2
Baths
1,394
Sq Ft
$692/Sq Ft
Est. Value
About This Home
This home is located at 2994 Cabrillo Mesa Dr, San Diego, CA 92123 and is currently estimated at $964,402, approximately $691 per square foot. 2994 Cabrillo Mesa Dr is a home located in San Diego County with nearby schools including Jones Elementary School, Taft Middle School, and Elevate Elementary School.
Ownership History
Date
Name
Owned For
Owner Type
Purchase Details
Closed on
Apr 23, 2012
Sold by
Blessing Charles and Blessing Carol
Bought by
Blessing Charles and Blessing Carol
Current Estimated Value
Home Financials for this Owner
Home Financials are based on the most recent Mortgage that was taken out on this home.
Original Mortgage
$278,000
Outstanding Balance
$50,355
Interest Rate
3.1%
Mortgage Type
New Conventional
Estimated Equity
$894,854
Purchase Details
Closed on
Feb 9, 2012
Sold by
Blessing Charles and Blessing Carol
Bought by
Blessing Charles and Blessing Carol
Purchase Details
Closed on
Sep 14, 1999
Sold by
Larson Robert G and Larson Dorothy J
Bought by
Blessing Charles and Blessing Carol
Home Financials for this Owner
Home Financials are based on the most recent Mortgage that was taken out on this home.
Original Mortgage
$196,381
Interest Rate
7.77%
Mortgage Type
FHA
Purchase Details
Closed on
Jan 16, 1992
Create a Home Valuation Report for This Property
The Home Valuation Report is an in-depth analysis detailing your home's value as well as a comparison with similar homes in the area
Home Values in the Area
Average Home Value in this Area
Purchase History
| Date | Buyer | Sale Price | Title Company |
|---|---|---|---|
| Blessing Charles | -- | Chicago Title Company | |
| Blessing Charles | -- | Chicago Title Company | |
| Blessing Charles | -- | None Available | |
| Blessing Charles | $198,000 | Chicago Title Co | |
| -- | $169,000 | -- |
Source: Public Records
Mortgage History
| Date | Status | Borrower | Loan Amount |
|---|---|---|---|
| Open | Blessing Charles | $278,000 | |
| Closed | Blessing Charles | $50,000 | |
| Closed | Blessing Charles | $250,000 | |
| Closed | Blessing Charles | $200,000 | |
| Closed | Blessing Charles | $196,381 |
Source: Public Records
Tax History Compared to Growth
Tax History
| Year | Tax Paid | Tax Assessment Tax Assessment Total Assessment is a certain percentage of the fair market value that is determined by local assessors to be the total taxable value of land and additions on the property. | Land | Improvement |
|---|---|---|---|---|
| 2024 | $3,613 | $298,328 | $130,626 | $167,702 |
| 2023 | $3,531 | $292,479 | $128,065 | $164,414 |
| 2022 | $3,436 | $286,745 | $125,554 | $161,191 |
| 2021 | $3,411 | $281,124 | $123,093 | $158,031 |
| 2020 | $3,369 | $278,242 | $121,831 | $156,411 |
| 2019 | $3,307 | $272,788 | $119,443 | $153,345 |
| 2018 | $3,092 | $267,440 | $117,101 | $150,339 |
| 2017 | $80 | $262,197 | $114,805 | $147,392 |
| 2016 | $2,966 | $257,056 | $112,554 | $144,502 |
| 2015 | $2,921 | $253,196 | $110,864 | $142,332 |
| 2014 | $2,875 | $248,237 | $108,693 | $139,544 |
Source: Public Records
Map
Nearby Homes
- 3031 Kobe Dr
- 2742 Kobe Dr
- 8401 Neva Ave
- 3031 Larkin Place
- 2687 Elyssee St
- 2649 Elyssee St
- 3488 Ediwhar Ave
- 8850 Raejean Ave
- 8835 Haveteur Way
- 9142 Irvington Ave
- 9209 Village Glen Dr Unit 146
- 3454 Castle Glen Dr Unit 145
- 3454 Castle Glen Dr Unit 123
- 3454 Castle Glen Dr Unit 215
- 9230 Irvington Ave
- 9289 Village Glen Dr Unit 112
- 3550 Ruffin Rd Unit 235
- 3550 Ruffin Rd Unit 142
- 3412 Marathon Dr
- 9341 Fermi Ave
- 2994 Cabrillo Mesa Dr
- 3004 Cabrillo Mesa Dr
- 2984 Cabrillo Mesa Dr
- 3015 Greyling Dr
- 3005 Greyling Dr Unit 2
- 3014 Cabrillo Mesa Dr
- 3025 Greyling Dr
- 2974 Cabrillo Mesa Dr
- 2991 Greyling Dr
- 2993 Cabrillo Mesa Dr
- 2983 Cabrillo Mesa Dr
- 3035 Greyling Dr
- 2981 Greyling Dr
- 3001 Cabrillo Mesa Dr
- 3024 Cabrillo Mesa Dr
- 2964 Cabrillo Mesa Dr
- 2973 Cabrillo Mesa Dr
- 3045 Greyling Dr
- 3011 Cabrillo Mesa Dr
- 2971 Greyling Dr