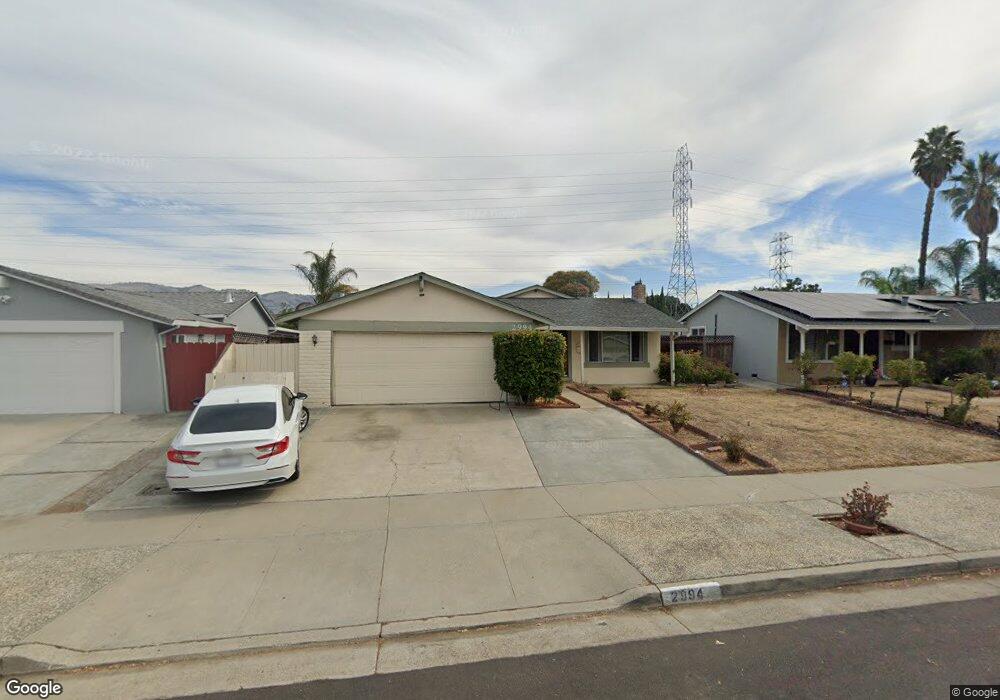
2994 Plumstead Way San Jose, CA 95148
Hidden Glen NeighborhoodEstimated Value: $1,241,924 - $1,432,000
3
Beds
2
Baths
1,298
Sq Ft
$1,023/Sq Ft
Est. Value
About This Home
This home is located at 2994 Plumstead Way, San Jose, CA 95148 and is currently estimated at $1,327,231, approximately $1,022 per square foot. 2994 Plumstead Way is a home located in Santa Clara County with nearby schools including Holly Oak Elementary School, George V. Leyva Intermediate School, and Silver Creek High School.
Ownership History
Date
Name
Owned For
Owner Type
Purchase Details
Closed on
Sep 17, 2013
Sold by
Nguyen Linh N and Tran Thanh Van L
Bought by
Nguyen Linh Ngoc and Tran Thanh Van Lam
Current Estimated Value
Purchase Details
Closed on
Dec 29, 2011
Sold by
Nguyen Linh N and Tran Thanh Van L
Bought by
Nguyen Linh N and Tran Thanh Van L
Home Financials for this Owner
Home Financials are based on the most recent Mortgage that was taken out on this home.
Original Mortgage
$244,800
Outstanding Balance
$28,014
Interest Rate
3.91%
Mortgage Type
New Conventional
Estimated Equity
$1,299,217
Purchase Details
Closed on
Dec 7, 2009
Sold by
Deutsche Bank National Trust Company
Bought by
Nguyen Linh N and Tran Thanh Van L
Home Financials for this Owner
Home Financials are based on the most recent Mortgage that was taken out on this home.
Original Mortgage
$326,250
Interest Rate
4.78%
Mortgage Type
New Conventional
Purchase Details
Closed on
Oct 13, 2009
Sold by
Ly Amy
Bought by
Deutsche Bank National Trust Company
Home Financials for this Owner
Home Financials are based on the most recent Mortgage that was taken out on this home.
Original Mortgage
$326,250
Interest Rate
4.78%
Mortgage Type
New Conventional
Purchase Details
Closed on
Jul 5, 2007
Sold by
Pandya Dipak M and Pandya Falguni D
Bought by
Ly Amy
Home Financials for this Owner
Home Financials are based on the most recent Mortgage that was taken out on this home.
Original Mortgage
$650,000
Interest Rate
7.5%
Mortgage Type
Purchase Money Mortgage
Purchase Details
Closed on
Jan 2, 2003
Sold by
Pandya Falguni D
Bought by
Pandya Dipak M and Pandya Falguni D
Home Financials for this Owner
Home Financials are based on the most recent Mortgage that was taken out on this home.
Original Mortgage
$328,000
Interest Rate
6.06%
Purchase Details
Closed on
Feb 20, 2002
Sold by
Pandye Dipak M
Bought by
Pandya Falguni D
Home Financials for this Owner
Home Financials are based on the most recent Mortgage that was taken out on this home.
Original Mortgage
$328,000
Interest Rate
7.04%
Purchase Details
Closed on
Feb 22, 1996
Sold by
Serpa George and Franca Serpa Brenda
Bought by
Thind Baljinder S and Thind Ravinder K
Home Financials for this Owner
Home Financials are based on the most recent Mortgage that was taken out on this home.
Original Mortgage
$166,000
Interest Rate
7.1%
Create a Home Valuation Report for This Property
The Home Valuation Report is an in-depth analysis detailing your home's value as well as a comparison with similar homes in the area
Home Values in the Area
Average Home Value in this Area
Purchase History
| Date | Buyer | Sale Price | Title Company |
|---|---|---|---|
| Nguyen Linh Ngoc | -- | None Available | |
| Nguyen Linh N | -- | Fidelity National Title Co | |
| Nguyen Linh N | $435,000 | Fidelity National Title Co | |
| Deutsche Bank National Trust Company | $350,000 | None Available | |
| Ly Amy | $750,000 | United General Title | |
| Pandya Dipak M | -- | Fidelity National Title Ins | |
| Pandya Falguni D | -- | Chicago Title Co | |
| Pandya Falguni D | $410,000 | Chicago Title Co | |
| Thind Baljinder S | $187,000 | Santa Clara Land Title Co |
Source: Public Records
Mortgage History
| Date | Status | Borrower | Loan Amount |
|---|---|---|---|
| Open | Nguyen Linh N | $244,800 | |
| Closed | Nguyen Linh N | $326,250 | |
| Previous Owner | Ly Amy | $650,000 | |
| Previous Owner | Pandya Dipak M | $328,000 | |
| Previous Owner | Pandya Falguni D | $328,000 | |
| Previous Owner | Thind Baljinder S | $166,000 |
Source: Public Records
Tax History Compared to Growth
Tax History
| Year | Tax Paid | Tax Assessment Tax Assessment Total Assessment is a certain percentage of the fair market value that is determined by local assessors to be the total taxable value of land and additions on the property. | Land | Improvement |
|---|---|---|---|---|
| 2025 | $8,647 | $561,491 | $258,155 | $303,336 |
| 2024 | $8,647 | $550,483 | $253,094 | $297,389 |
| 2023 | $8,467 | $539,690 | $248,132 | $291,558 |
| 2022 | $8,426 | $529,109 | $243,267 | $285,842 |
| 2021 | $8,260 | $518,736 | $238,498 | $280,238 |
| 2020 | $7,898 | $513,418 | $236,053 | $277,365 |
| 2019 | $7,694 | $503,352 | $231,425 | $271,927 |
| 2018 | $7,606 | $493,484 | $226,888 | $266,596 |
| 2017 | $7,483 | $483,809 | $222,440 | $261,369 |
| 2016 | $7,136 | $474,324 | $218,079 | $256,245 |
| 2015 | $7,040 | $467,200 | $214,804 | $252,396 |
| 2014 | $6,420 | $458,049 | $210,597 | $247,452 |
Source: Public Records
Map
Nearby Homes
- 2629 Whispering Hills Dr
- 2574 Whispering Hills Cir Unit 2574
- 3211 Pentland Ct
- 2271 Pumpherston Ct
- 2021 Bridgecastle Ct
- 2552 Castleton Dr
- 2629 Whispering Hills Cir Unit 2629
- 2544 Glenrio Dr
- 2805 Gavilan Dr
- 2837 Burdick Way
- 1868 Bagpipe Way
- 2114 Bennighof Ct
- 2680 Chopin Ave
- 2507 Bankhead Way
- 2154 Pastoral Loop
- 2666 Hesselbein Way
- 2991 Vanport Dr
- 2834 White Acres Dr
- 000 Gilham Way
- 2955 Vineyard Park Dr
- 2988 Plumstead Way
- 3002 Plumstead Way
- 2980 Plumstead Way
- 3008 Plumstead Way
- 2983 Fenwick Way
- 2979 Fenwick Way
- 2987 Fenwick Way
- 2975 Fenwick Way
- 2995 Plumstead Way
- 2974 Plumstead Way
- 2989 Plumstead Way
- 3003 Plumstead Way
- 2251 Plumstead Ct
- 2971 Fenwick Way
- 2257 Plumstead Ct
- 2981 Plumstead Way
- 2263 Plumstead Ct
- 3009 Plumstead Way
- 2966 Plumstead Way
- 2975 Plumstead Way