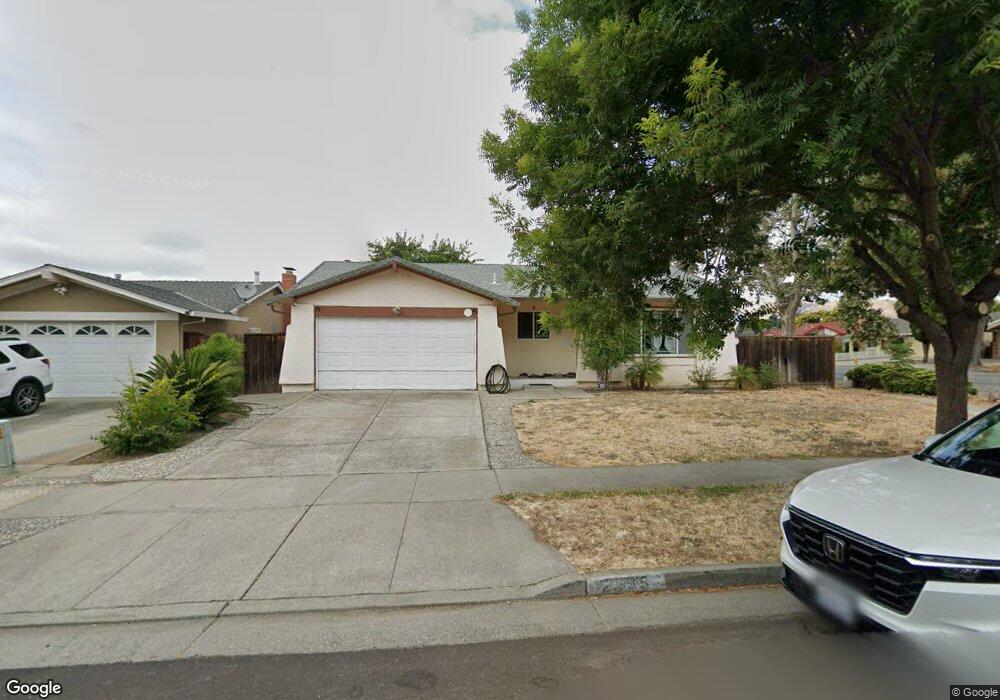
2995 Valhalla Dr San Jose, CA 95132
Cataldi NeighborhoodEstimated Value: $1,525,000 - $1,781,000
4
Beds
2
Baths
1,536
Sq Ft
$1,056/Sq Ft
Est. Value
About This Home
This home is located at 2995 Valhalla Dr, San Jose, CA 95132 and is currently estimated at $1,621,804, approximately $1,055 per square foot. 2995 Valhalla Dr is a home located in Santa Clara County with nearby schools including Northwood Elementary School, Morrill Middle School, and Independence High School.
Ownership History
Date
Name
Owned For
Owner Type
Purchase Details
Closed on
Dec 8, 2011
Sold by
Tran Lien K and Neal Glenn
Bought by
Nguyen Kevin T
Current Estimated Value
Home Financials for this Owner
Home Financials are based on the most recent Mortgage that was taken out on this home.
Original Mortgage
$348,000
Outstanding Balance
$237,254
Interest Rate
3.94%
Mortgage Type
New Conventional
Estimated Equity
$1,384,550
Purchase Details
Closed on
Mar 23, 2006
Sold by
Lata Som and Tomer Siddhartha
Bought by
Tran Lien K and Neal Glenn
Home Financials for this Owner
Home Financials are based on the most recent Mortgage that was taken out on this home.
Original Mortgage
$536,250
Interest Rate
6.5%
Mortgage Type
Fannie Mae Freddie Mac
Purchase Details
Closed on
Jul 27, 1998
Sold by
Lata Som
Bought by
Lata Som and Tomer Siddhartha
Purchase Details
Closed on
Mar 4, 1995
Sold by
Lata Som
Bought by
Lata Som
Create a Home Valuation Report for This Property
The Home Valuation Report is an in-depth analysis detailing your home's value as well as a comparison with similar homes in the area
Home Values in the Area
Average Home Value in this Area
Purchase History
| Date | Buyer | Sale Price | Title Company |
|---|---|---|---|
| Nguyen Kevin T | $435,000 | First American Title Company | |
| Tran Lien K | $715,000 | Commonwealth Land Title Co | |
| Lata Som | -- | Fidelity National Title Co | |
| Lata Som | -- | -- |
Source: Public Records
Mortgage History
| Date | Status | Borrower | Loan Amount |
|---|---|---|---|
| Open | Nguyen Kevin T | $348,000 | |
| Previous Owner | Tran Lien K | $536,250 |
Source: Public Records
Tax History
| Year | Tax Paid | Tax Assessment Tax Assessment Total Assessment is a certain percentage of the fair market value that is determined by local assessors to be the total taxable value of land and additions on the property. | Land | Improvement |
|---|---|---|---|---|
| 2025 | $8,225 | $546,372 | $382,464 | $163,908 |
| 2024 | $8,225 | $535,660 | $374,965 | $160,695 |
| 2023 | $8,063 | $525,158 | $367,613 | $157,545 |
| 2022 | $8,025 | $514,861 | $360,405 | $154,456 |
| 2021 | $7,752 | $504,767 | $353,339 | $151,428 |
| 2020 | $7,502 | $499,592 | $349,716 | $149,876 |
| 2019 | $7,214 | $489,797 | $342,859 | $146,938 |
| 2018 | $7,105 | $480,194 | $336,137 | $144,057 |
| 2017 | $7,137 | $470,780 | $329,547 | $141,233 |
| 2016 | $6,838 | $461,550 | $323,086 | $138,464 |
| 2015 | $6,755 | $454,618 | $318,233 | $136,385 |
| 2014 | $6,123 | $445,714 | $312,000 | $133,714 |
Source: Public Records
Map
Nearby Homes
- 1831 Morrill Ave
- 2854 Agua Vista Dr
- 2838 Agua Vista Dr
- 3184 Fernside Square
- 1912 Vinedale Square
- 2877 Bellini Ct
- 3023 Postwood Dr
- 2085 Ashwood Ln
- 2074 Ashwood Ln
- 2848 Donizetti Ct
- 3139 Laneview Dr
- 1414 Turlock Ln
- 2582 Minuet Dr
- 3312 Birchwood Ln
- 2178 Ashwood Ln
- 2415 Stearman Ct Unit 7
- 2610 Autumnvale Dr
- 2280 Zoria Cir
- 2158 Capitol Park Ct
- 1402 Almanor Ct
- 2989 Valhalla Dr
- 2998 Tobin Dr
- 2983 Valhalla Dr
- 2992 Tobin Dr
- 1796 Morrill Ave Unit 1796
- 1777 Morrill Ave
- 2986 Tobin Dr
- 2975 Valhalla Dr
- 1786 Morrill Ave
- 1790 Morrill Ave
- 1782 Morrill Ave
- 1794 Morrill Ave
- 2978 Tobin Dr
- 1776 Valhalla Ct
- 1773 Morrill Ave
- 1778 Morrill Ave
- 2967 Valhalla Dr
- 1798 Morrill Ave Unit Studio
- 1798 Morrill Ave Unit 2
- 1798 Morrill Ave
Your Personal Tour Guide
Ask me questions while you tour the home.