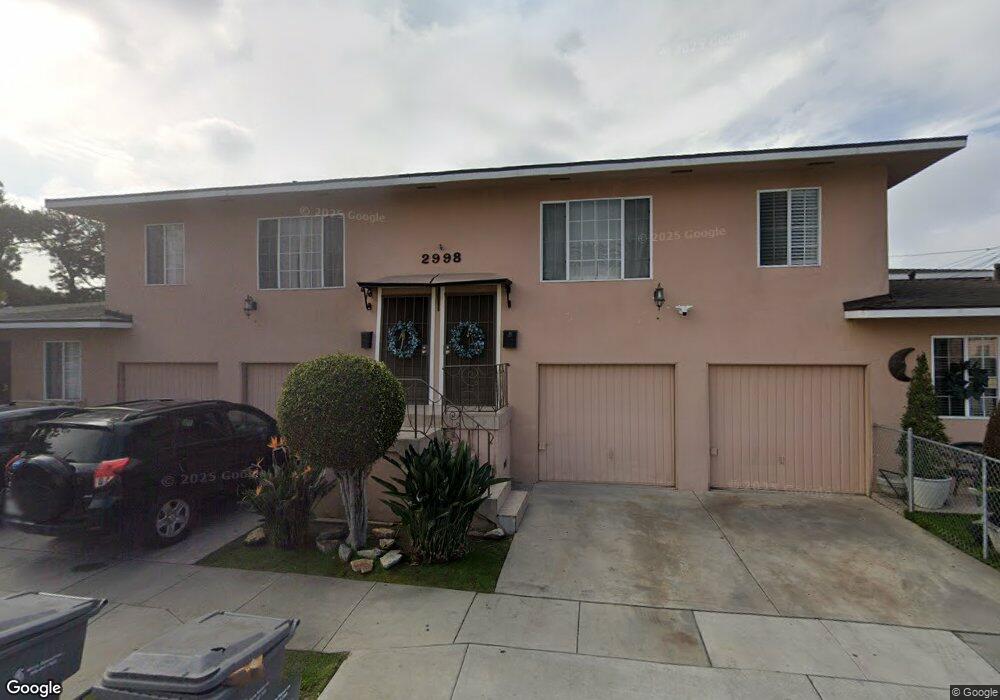
2998 Oakwood Ave Unit A Lynwood, CA 90262
Estimated Value: $759,664 - $884,000
4
Beds
4
Baths
2,455
Sq Ft
$337/Sq Ft
Est. Value
About This Home
This home is located at 2998 Oakwood Ave Unit A, Lynwood, CA 90262 and is currently estimated at $827,666, approximately $337 per square foot. 2998 Oakwood Ave Unit A is a home located in Los Angeles County with nearby schools including Lincoln Elementary School, Cesar Chavez Middle School, and Lynwood High School.
Ownership History
Date
Name
Owned For
Owner Type
Purchase Details
Closed on
Aug 14, 2006
Sold by
Torres Maria
Bought by
Torres Jesus
Current Estimated Value
Home Financials for this Owner
Home Financials are based on the most recent Mortgage that was taken out on this home.
Original Mortgage
$429,000
Outstanding Balance
$310,274
Interest Rate
10.95%
Mortgage Type
Purchase Money Mortgage
Estimated Equity
$517,392
Purchase Details
Closed on
Nov 23, 2004
Sold by
Gerhardt Living Trust
Bought by
Torres Jesus
Home Financials for this Owner
Home Financials are based on the most recent Mortgage that was taken out on this home.
Original Mortgage
$395,000
Interest Rate
5.67%
Mortgage Type
Seller Take Back
Purchase Details
Closed on
Mar 1, 2002
Sold by
Gerhardt William Charles
Bought by
Gerhardt William C and Gerhardt Living Trust
Purchase Details
Closed on
Dec 21, 1994
Sold by
Gerhardt Elouse Christine
Bought by
Gerhardt William Charles
Create a Home Valuation Report for This Property
The Home Valuation Report is an in-depth analysis detailing your home's value as well as a comparison with similar homes in the area
Home Values in the Area
Average Home Value in this Area
Purchase History
| Date | Buyer | Sale Price | Title Company |
|---|---|---|---|
| Torres Jesus | -- | North American Title Co | |
| Torres Jesus | $395,000 | Gateway Title Company | |
| Torres Jesus | -- | -- | |
| Gerhardt William C | -- | -- | |
| Gerhardt William Charles | -- | -- |
Source: Public Records
Mortgage History
| Date | Status | Borrower | Loan Amount |
|---|---|---|---|
| Open | Torres Jesus | $429,000 | |
| Previous Owner | Torres Jesus | $395,000 |
Source: Public Records
Tax History Compared to Growth
Tax History
| Year | Tax Paid | Tax Assessment Tax Assessment Total Assessment is a certain percentage of the fair market value that is determined by local assessors to be the total taxable value of land and additions on the property. | Land | Improvement |
|---|---|---|---|---|
| 2025 | $8,182 | $550,579 | $355,440 | $195,139 |
| 2024 | $8,182 | $539,784 | $348,471 | $191,313 |
| 2023 | $8,121 | $529,201 | $341,639 | $187,562 |
| 2022 | $7,837 | $518,826 | $334,941 | $183,885 |
| 2021 | $7,552 | $508,654 | $328,374 | $180,280 |
| 2019 | $7,724 | $493,569 | $318,635 | $174,934 |
| 2018 | $7,134 | $483,892 | $312,388 | $171,504 |
| 2016 | $6,652 | $465,104 | $300,258 | $164,846 |
| 2015 | $6,519 | $458,118 | $295,748 | $162,370 |
| 2014 | $6,383 | $449,145 | $289,955 | $159,190 |
Source: Public Records
Map
Nearby Homes
- 3100 Los Flores Blvd
- 2975 Fernwood Ave
- 11251 State St
- 11150 Franklin St
- 11141 Franklin St
- 3323 Los Flores Blvd
- 3364 Elizabeth Ave
- 3220 Tecumseh Ave
- 2649 111th St
- 3535 Los Flores Blvd
- 10430 San Jose Ave
- 2554 Santa Ana Blvd S
- 10401 State St
- 3580 Beechwood Ave
- 10355 Long Beach Blvd
- 10303 Long Beach Blvd
- 2432 E 112th Place
- 2459 E 111th St
- 3356 Josephine St
- 11952 Santa fe Ave
- 11117 State St
- 2994 Oakwood Ave
- 2993 Oakwood Ave
- 2980 Oakwood Ave
- 2978 Oakwood Ave
- 2987 Oakwood Ave
- 2976 Oakwood Ave
- 11101 State St
- 2981 Oakwood Ave
- 3102 Oakwood Ave
- 11136 State St
- 11118 State St
- 2974 Oakwood Ave
- 2979 Oakwood Ave
- 2994 Los Flores Blvd
- 11142 State St
- 11150 State St
- 11110 State St
- 2975 Oakwood Ave
- 3101 E Imperial Hwy