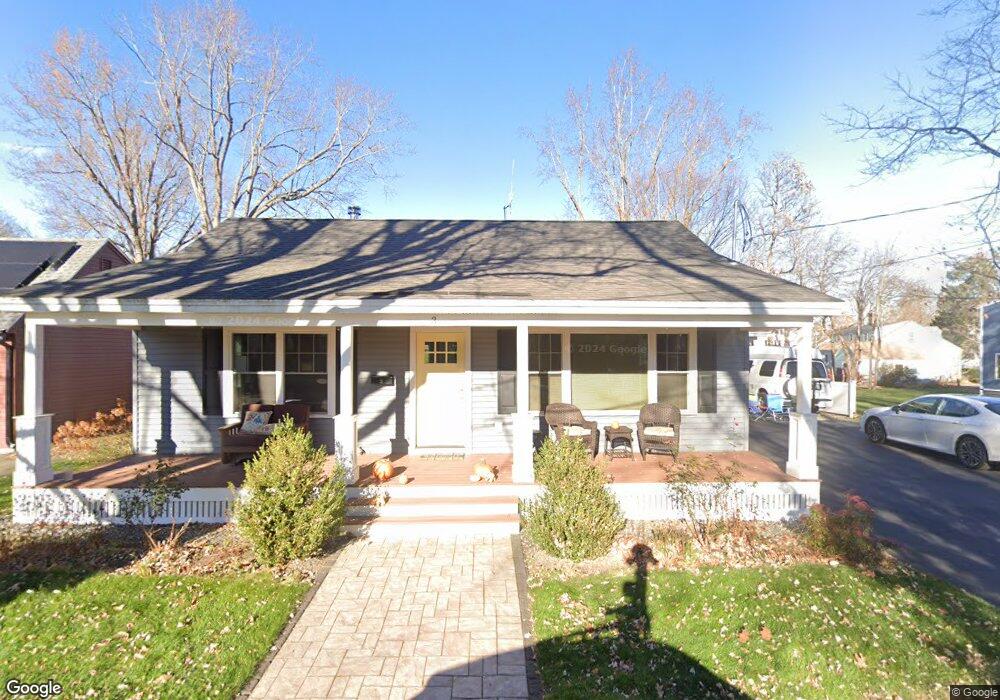
3 1/2 Spruce St Exeter, NH 03833
Estimated Value: $484,000 - $726,000
3
Beds
2
Baths
1,448
Sq Ft
$397/Sq Ft
Est. Value
About This Home
This home is located at 3 1/2 Spruce St, Exeter, NH 03833 and is currently estimated at $575,430, approximately $397 per square foot. 3 1/2 Spruce St is a home with nearby schools including Main Street School, Lincoln Street Elementary School, and Cooperative Middle School.
Ownership History
Date
Name
Owned For
Owner Type
Purchase Details
Closed on
Sep 12, 2019
Sold by
Thibault Gerard
Bought by
Finch Nancy D and Finch Peter B
Current Estimated Value
Purchase Details
Closed on
Nov 5, 2018
Sold by
Mcdermott Sean P and Mcdermott Sandra M
Bought by
Thibault Gerard
Home Financials for this Owner
Home Financials are based on the most recent Mortgage that was taken out on this home.
Original Mortgage
$204,000
Interest Rate
4.6%
Purchase Details
Closed on
Aug 31, 2004
Sold by
Coombs David E
Bought by
Mcdermott Sean P and Mcdermott Sandra M
Home Financials for this Owner
Home Financials are based on the most recent Mortgage that was taken out on this home.
Original Mortgage
$179,920
Interest Rate
6.02%
Mortgage Type
Purchase Money Mortgage
Create a Home Valuation Report for This Property
The Home Valuation Report is an in-depth analysis detailing your home's value as well as a comparison with similar homes in the area
Home Values in the Area
Average Home Value in this Area
Purchase History
We collect this data history from publicly available records. To have your information removed, we recommend requesting removal directly through your county’s website.
| Date | Buyer | Sale Price | Title Company |
|---|---|---|---|
| Finch Nancy D | $475,000 | -- | |
| Thibault Gerard | $240,000 | -- | |
| Mcdermott Sean P | $224,900 | -- |
Source: Public Records
Mortgage History
We collect this data history from publicly available records. To have your information removed, we recommend requesting removal directly through your county’s website.
| Date | Status | Borrower | Loan Amount |
|---|---|---|---|
| Previous Owner | Thibault Gerard | $204,000 | |
| Previous Owner | Mcdermott Sean P | $186,070 | |
| Previous Owner | Mcdermott Sean P | $179,920 |
Source: Public Records
Tax History
| Year | Tax Paid | Tax Assessment Tax Assessment Total Assessment is a certain percentage of the fair market value that is determined by local assessors to be the total taxable value of land and additions on the property. | Land | Improvement |
|---|---|---|---|---|
| 2025 | $9,264 | $493,800 | $222,500 | $271,300 |
| 2024 | $8,785 | $493,800 | $222,500 | $271,300 |
| 2023 | $8,272 | $308,900 | $130,900 | $178,000 |
| 2022 | $7,645 | $308,900 | $130,900 | $178,000 |
| 2021 | $7,417 | $308,900 | $130,900 | $178,000 |
| 2020 | $7,565 | $308,900 | $130,900 | $178,000 |
| 2019 | $7,188 | $308,900 | $130,900 | $178,000 |
| 2018 | $4,540 | $165,100 | $84,100 | $81,000 |
| 2017 | $4,355 | $162,700 | $84,100 | $78,600 |
| 2016 | $4,269 | $162,700 | $84,100 | $78,600 |
| 2015 | $4,155 | $162,700 | $84,100 | $78,600 |
| 2014 | $3,826 | $146,800 | $84,100 | $62,700 |
| 2013 | $3,821 | $146,800 | $84,100 | $62,700 |
| 2011 | $3,711 | $146,800 | $84,100 | $62,700 |
Source: Public Records
Map
Nearby Homes
- 17-19 Dartmouth St
- 36 Washington St
- 180 Front St
- 68 Main St
- 156 Front St Unit 206
- 5 Brookside Dr Unit 9
- 30 Charter St Unit 14
- 50 Brookside Dr Unit 5
- 50 Brookside Dr Unit 7
- 76 Wadleigh St Unit 37
- 72 Wadleigh St Unit 38
- 86 Wadleigh St Unit 34
- 100 Wadleigh St Unit 30
- 21 Wadleigh St Unit LOT 6
- 81 Front St Unit 6
- 12 Little River Rd Unit 7
- 23 Gill St
- 22 Pine St
- 50 Linden St
- 39 Ernest Ave Unit 308
- 43 1/2 Winter St
- 43 Winter St
- 43 Winter St Unit B
- 43 Winter St Unit A
- 45 Winter St
- 3 Spruce St
- 3 Spruce St
- 3 Spruce St
- 41 Winter St
- 2 Whitley Rd
- 49 Winter St
- 44 Winter St Unit 46
- 44-46 Winter St Unit 2
- 44 Winter St Unit 1
- 44 Winter St Unit 2
- 5 Spruce St
- 42 Winter St
- 5 Spruce St
- 4 Whitley Rd
- 4 Spruce St
Your Personal Tour Guide
Ask me questions while you tour the home.