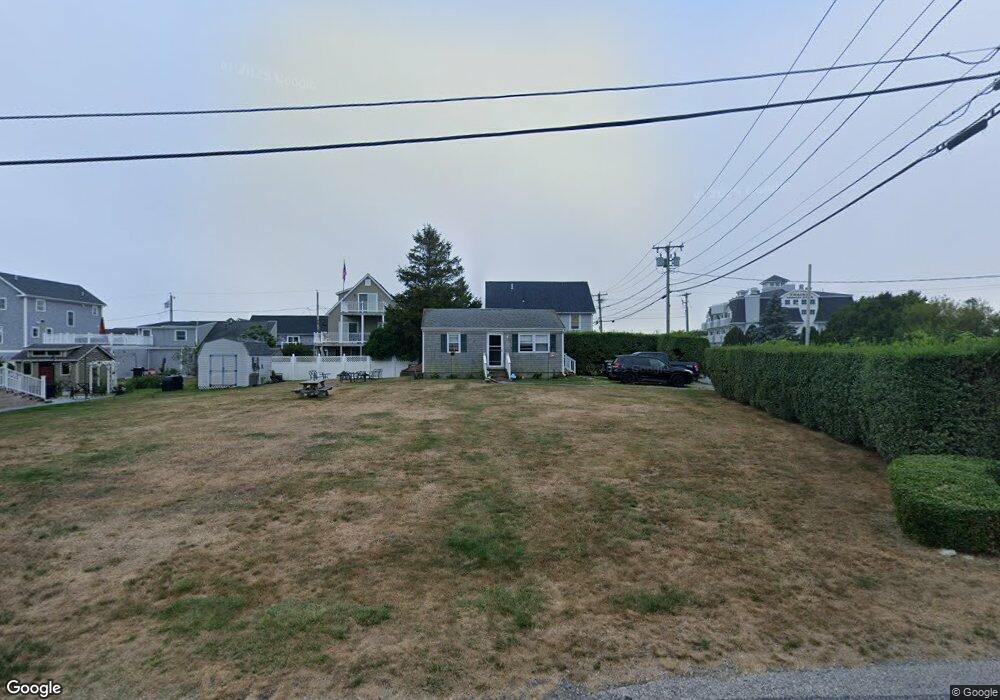
3 2nd St Narragansett, RI 02882
Estimated Value: $713,000 - $815,000
2
Beds
1
Bath
560
Sq Ft
$1,355/Sq Ft
Est. Value
About This Home
This home is located at 3 2nd St, Narragansett, RI 02882 and is currently estimated at $758,580, approximately $1,354 per square foot. 3 2nd St is a home located in Washington County with nearby schools including Narragansett Elementary School, Narragansett Pier Middle School, and Narragansett High School.
Ownership History
Date
Name
Owned For
Owner Type
Purchase Details
Closed on
Dec 3, 2024
Sold by
Jacquelyn H Tracy Ret and Tracy
Bought by
Little Homes Llc
Current Estimated Value
Purchase Details
Closed on
Jan 11, 2018
Sold by
Tracy Jacquelyn H
Bought by
Tracy Jacquelyn H
Purchase Details
Closed on
Jul 27, 2000
Sold by
Andreozzi Victor P
Bought by
Tracy Jacquelyn H
Home Financials for this Owner
Home Financials are based on the most recent Mortgage that was taken out on this home.
Original Mortgage
$147,250
Interest Rate
8.18%
Purchase Details
Closed on
Sep 8, 1998
Sold by
Mccaffrey Doris and Garvin Lorraine M
Bought by
Andreozzi Victor P
Create a Home Valuation Report for This Property
The Home Valuation Report is an in-depth analysis detailing your home's value as well as a comparison with similar homes in the area
Home Values in the Area
Average Home Value in this Area
Purchase History
| Date | Buyer | Sale Price | Title Company |
|---|---|---|---|
| Little Homes Llc | -- | None Available | |
| Little Homes Llc | -- | None Available | |
| Little Homes Llc | -- | None Available | |
| Tracy Jacquelyn H | -- | -- | |
| Tracy Jacquelyn H | $155,000 | -- | |
| Andreozzi Victor P | $92,000 | -- | |
| Tracy Jacquelyn H | -- | -- | |
| Tracy Jacquelyn H | $155,000 | -- | |
| Andreozzi Victor P | $92,000 | -- |
Source: Public Records
Mortgage History
| Date | Status | Borrower | Loan Amount |
|---|---|---|---|
| Previous Owner | Andreozzi Victor P | $145,000 | |
| Previous Owner | Andreozzi Victor P | $143,000 | |
| Previous Owner | Andreozzi Victor P | $147,250 |
Source: Public Records
Tax History Compared to Growth
Tax History
| Year | Tax Paid | Tax Assessment Tax Assessment Total Assessment is a certain percentage of the fair market value that is determined by local assessors to be the total taxable value of land and additions on the property. | Land | Improvement |
|---|---|---|---|---|
| 2025 | $3,705 | $545,700 | $418,200 | $127,500 |
| 2024 | $3,574 | $545,700 | $418,200 | $127,500 |
| 2023 | $3,504 | $376,400 | $278,700 | $97,700 |
| 2022 | $3,388 | $376,400 | $278,700 | $97,700 |
| 2021 | $3,335 | $376,400 | $278,700 | $97,700 |
| 2020 | $3,095 | $295,300 | $212,000 | $83,300 |
| 2019 | $3,021 | $295,300 | $212,000 | $83,300 |
| 2018 | $2,938 | $295,300 | $212,000 | $83,300 |
| 2017 | $3,071 | $290,800 | $221,800 | $69,000 |
| 2016 | $2,931 | $290,800 | $221,800 | $69,000 |
| 2015 | $2,891 | $290,800 | $221,800 | $69,000 |
| 2014 | $3,493 | $347,900 | $266,200 | $81,700 |
Source: Public Records
Map
Nearby Homes
- 1125 Point Judith Rd Unit B6
- 8 Pocono Rd
- 0 Point Judith Rd
- 100 Chestnut Ave
- 1046 Ocean Rd
- 1044 Ocean Rd
- 89 Sand Hill Cove Rd
- 110 Houston Ave
- 4 Lane 3
- 6 Lane 4
- 8 Knowlesway
- 129 Sand Hill Cove Rd
- 45 Durkin Dr
- 31 E Pond Rd
- 64 Burnside Ave
- 17 Goose Island Rd
- 25 Scallop Shell Rd
- 271 Great Island Rd
- 20 Marine Dr
- 27 Foster Ln