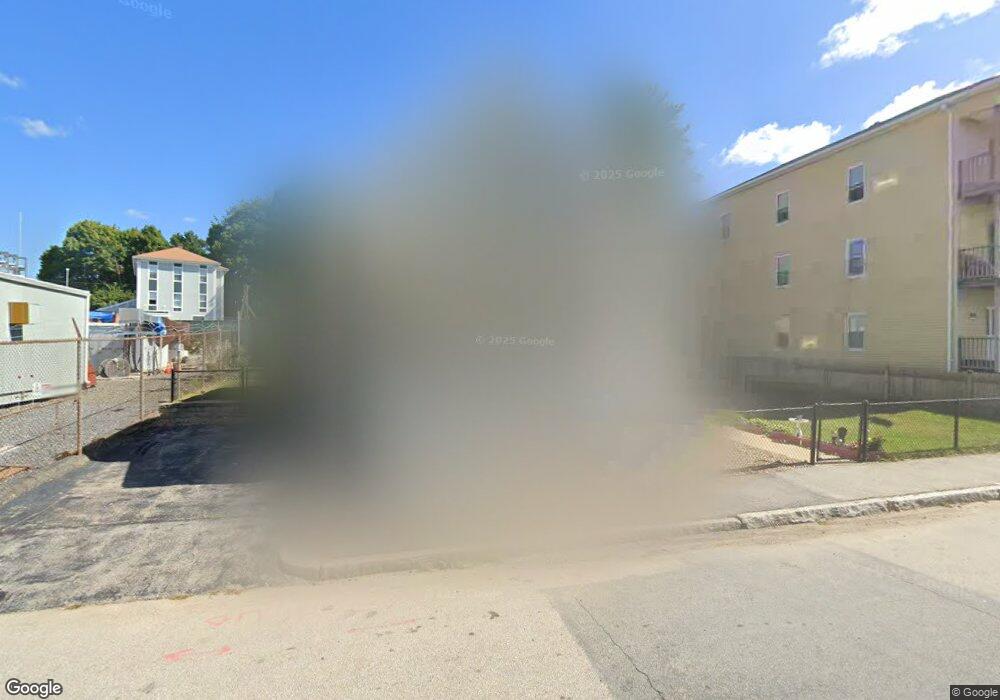
3 Bancroft St Worcester, MA 01610
University Park NeighborhoodEstimated Value: $280,589 - $382,000
2
Beds
2
Baths
1,260
Sq Ft
$254/Sq Ft
Est. Value
About This Home
This home is located at 3 Bancroft St, Worcester, MA 01610 and is currently estimated at $320,397, approximately $254 per square foot. 3 Bancroft St is a home located in Worcester County with nearby schools including Chandler Elementary Community School, Jacob Hiatt Magnet School, and Chandler Magnet.
Ownership History
Date
Name
Owned For
Owner Type
Purchase Details
Closed on
Jun 15, 2012
Sold by
Worcester Common Groun
Bought by
Austin Corridor 2 Lp
Current Estimated Value
Home Financials for this Owner
Home Financials are based on the most recent Mortgage that was taken out on this home.
Original Mortgage
$1,000,000
Outstanding Balance
$683,788
Interest Rate
3.85%
Mortgage Type
Purchase Money Mortgage
Estimated Equity
-$363,391
Purchase Details
Closed on
Nov 16, 2010
Sold by
Homesales Inc
Bought by
Worcester Cmn Ground I
Purchase Details
Closed on
Jun 7, 2010
Sold by
Moreno-Hernandes Enid and Jp Morgan Chase
Bought by
Homesales Inc
Purchase Details
Closed on
Dec 9, 2005
Sold by
Schwing Cheryl A and Donabedian Shirley J
Bought by
Moreno-Hernandes Enid
Home Financials for this Owner
Home Financials are based on the most recent Mortgage that was taken out on this home.
Original Mortgage
$127,200
Interest Rate
6.17%
Mortgage Type
Purchase Money Mortgage
Create a Home Valuation Report for This Property
The Home Valuation Report is an in-depth analysis detailing your home's value as well as a comparison with similar homes in the area
Home Values in the Area
Average Home Value in this Area
Purchase History
| Date | Buyer | Sale Price | Title Company |
|---|---|---|---|
| Austin Corridor 2 Lp | $520,000 | -- | |
| Austin Corridor 2 Lp | $520,000 | -- | |
| Worcester Cmn Ground I | $61,503 | -- | |
| Homesales Inc | $39,000 | -- | |
| Moreno-Hernandes Enid | $159,000 | -- |
Source: Public Records
Mortgage History
| Date | Status | Borrower | Loan Amount |
|---|---|---|---|
| Open | Austin Corridor 2 Lp | $1,000,000 | |
| Closed | Austin Corridor 2 Lp | $751,629 | |
| Closed | Austin Corridor 2 Lp | $400,000 | |
| Closed | Austin Corridor 2 Lp | $0 | |
| Closed | Austin Corridor 2 Lp | $1,000,000 | |
| Previous Owner | Moreno-Hernandes Enid | $127,200 |
Source: Public Records
Tax History
| Year | Tax Paid | Tax Assessment Tax Assessment Total Assessment is a certain percentage of the fair market value that is determined by local assessors to be the total taxable value of land and additions on the property. | Land | Improvement |
|---|---|---|---|---|
| 2025 | $1,674 | $126,881 | $61,300 | $65,581 |
| 2024 | $1,644 | $119,598 | $61,300 | $58,298 |
| 2023 | $1,715 | $119,598 | $49,200 | $70,398 |
| 2022 | $1,766 | $116,115 | $39,400 | $76,715 |
| 2021 | $4,010 | $246,300 | $31,500 | $214,800 |
| 2020 | $3,759 | $221,100 | $31,600 | $189,500 |
| 2019 | $3,667 | $203,700 | $31,200 | $172,500 |
| 2018 | $3,621 | $191,500 | $31,200 | $160,300 |
| 2017 | $3,431 | $178,500 | $31,200 | $147,300 |
| 2016 | $3,586 | $174,000 | $25,400 | $148,600 |
| 2015 | $3,492 | $174,000 | $25,400 | $148,600 |
| 2014 | $3,400 | $174,000 | $25,400 | $148,600 |
Source: Public Records
Map
Nearby Homes
- 5 Bancroft St
- 84 Bellevue St
- 6 Bancroft St
- 6 Bancroft St Unit 1
- 6 Bancroft St Unit 2
- 6 Bancroft St Unit 3
- 4 Bancroft St
- 7 Bancroft St
- 2 Bancroft St
- 204 Chandler St
- 86 Bellevue St
- 9 Bancroft St
- 206 Chandler St
- 200 Chandler St
- 37 Mason St
- 90 Bellevue St
- 35 Mason St
- 11 Bancroft St
- 73 Bellevue St
- 210 Chandler St
Your Personal Tour Guide
Ask me questions while you tour the home.