Estimated Value: $938,000 - $1,219,000
3
Beds
3
Baths
1,806
Sq Ft
$581/Sq Ft
Est. Value
About This Home
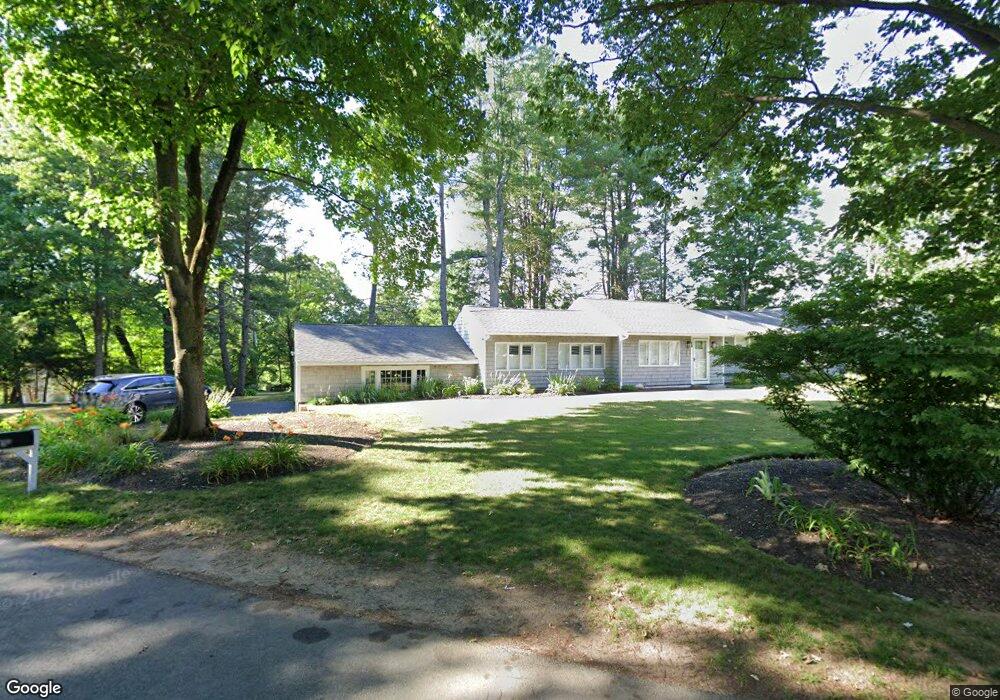
This home is located at 3 Beldon Rd, Dover, MA 02030 and is currently estimated at $1,048,495, approximately $580 per square foot. 3 Beldon Rd is a home located in Norfolk County with nearby schools including Chickering Elementary School, Dover-Sherborn Regional Middle School, and Dover-Sherborn Regional High School.
Ownership History
Date
Name
Owned For
Owner Type
Purchase Details
Closed on
Jan 14, 2000
Sold by
Near William K and Near Beverly
Bought by
Roman Derek M and Roman Nicole M
Current Estimated Value
Home Financials for this Owner
Home Financials are based on the most recent Mortgage that was taken out on this home.
Original Mortgage
$304,000
Interest Rate
7.79%
Mortgage Type
Purchase Money Mortgage
Create a Home Valuation Report for This Property
The Home Valuation Report is an in-depth analysis detailing your home's value as well as a comparison with similar homes in the area
Home Values in the Area
Average Home Value in this Area
Purchase History
| Date | Buyer | Sale Price | Title Company |
|---|---|---|---|
| Roman Derek M | $340,000 | -- |
Source: Public Records
Mortgage History
| Date | Status | Borrower | Loan Amount |
|---|---|---|---|
| Open | Roman Derek M | $221,000 | |
| Closed | Roman Derek M | $232,000 | |
| Closed | Roman Derek M | $295,000 | |
| Closed | Roman Derek M | $304,000 |
Source: Public Records
Tax History
| Year | Tax Paid | Tax Assessment Tax Assessment Total Assessment is a certain percentage of the fair market value that is determined by local assessors to be the total taxable value of land and additions on the property. | Land | Improvement |
|---|---|---|---|---|
| 2025 | $8,726 | $774,300 | $482,000 | $292,300 |
| 2024 | $8,095 | $738,600 | $465,600 | $273,000 |
| 2023 | $8,116 | $665,800 | $408,500 | $257,300 |
| 2022 | $7,651 | $616,000 | $392,100 | $223,900 |
| 2021 | $7,788 | $604,200 | $392,100 | $212,100 |
| 2020 | $8,386 | $653,100 | $392,100 | $261,000 |
| 2019 | $6,566 | $507,800 | $392,100 | $115,700 |
| 2018 | $6,804 | $529,900 | $392,100 | $137,800 |
| 2017 | $6,701 | $513,500 | $359,500 | $154,000 |
| 2016 | $6,520 | $506,200 | $359,500 | $146,700 |
| 2015 | $6,242 | $491,500 | $341,500 | $150,000 |
Source: Public Records
Map
Nearby Homes
- 8 Warren Rd
- 84 Pleasant St
- 9 Buttercup Ln
- 68 Locust Ln
- 182 Winding River Rd
- 22 Lincoln St S
- 12 Winding River Cir
- 42 Troutbrook Rd
- 104 Glen St
- 83 Eliot St
- 17 Eliot St
- 18 Phillips Pond Rd
- 121 Livingston Rd
- 3 Parsons Way
- 2 Phillips Pond Rd
- 389 Grove St
- 22 Main St
- 104 Eliot St
- 62 Claybrook Rd
- 60 Claybrook Rd
Your Personal Tour Guide
Ask me questions while you tour the home.