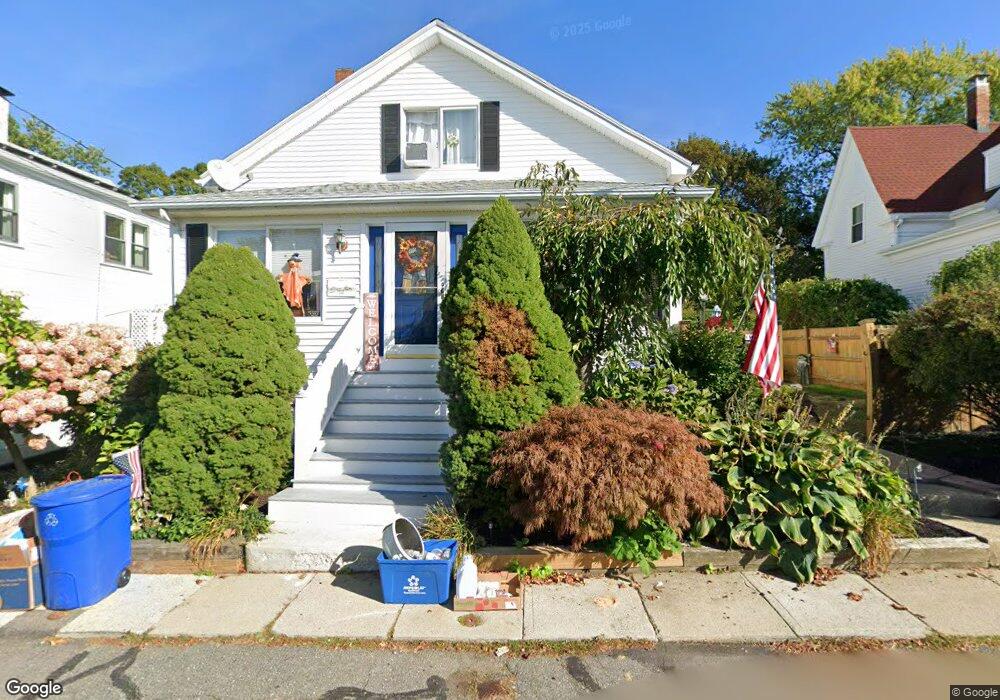
3 Blake Ct Gloucester, MA 01930
East Gloucester NeighborhoodEstimated Value: $715,924 - $998,000
4
Beds
3
Baths
1,986
Sq Ft
$426/Sq Ft
Est. Value
About This Home
This home is located at 3 Blake Ct, Gloucester, MA 01930 and is currently estimated at $846,731, approximately $426 per square foot. 3 Blake Ct is a home located in Essex County with nearby schools including East Gloucester Elementary School, Ralph B O'maley Middle School, and Gloucester High School.
Ownership History
Date
Name
Owned For
Owner Type
Purchase Details
Closed on
Dec 15, 2000
Sold by
Manninen Robert C and Manninen Theresa A
Bought by
Ryan Debra A
Current Estimated Value
Create a Home Valuation Report for This Property
The Home Valuation Report is an in-depth analysis detailing your home's value as well as a comparison with similar homes in the area
Home Values in the Area
Average Home Value in this Area
Purchase History
| Date | Buyer | Sale Price | Title Company |
|---|---|---|---|
| Ryan Debra A | $282,500 | -- |
Source: Public Records
Mortgage History
| Date | Status | Borrower | Loan Amount |
|---|---|---|---|
| Open | Ryan Debra A | $123,000 | |
| Closed | Ryan Debra A | $25,000 | |
| Closed | Ryan Debra A | $142,000 |
Source: Public Records
Tax History
| Year | Tax Paid | Tax Assessment Tax Assessment Total Assessment is a certain percentage of the fair market value that is determined by local assessors to be the total taxable value of land and additions on the property. | Land | Improvement |
|---|---|---|---|---|
| 2025 | $6,306 | $648,800 | $197,600 | $451,200 |
| 2024 | $6,163 | $633,400 | $188,100 | $445,300 |
| 2023 | $5,901 | $557,200 | $168,000 | $389,200 |
| 2022 | $5,676 | $483,900 | $142,800 | $341,100 |
| 2021 | $5,479 | $440,400 | $129,800 | $310,600 |
| 2020 | $5,461 | $442,900 | $129,800 | $313,100 |
| 2019 | $5,233 | $412,400 | $129,800 | $282,600 |
| 2018 | $5,065 | $391,700 | $129,800 | $261,900 |
| 2017 | $4,908 | $372,100 | $123,700 | $248,400 |
| 2016 | $4,747 | $348,800 | $124,100 | $224,700 |
| 2015 | $4,528 | $331,700 | $124,100 | $207,600 |
Source: Public Records
Map
Nearby Homes
- 3 Mondello Square
- 70 Bass Ave
- 5 Wise Place
- 36 Eastern Ave
- 197 E Main St Unit 1
- 139A Prospect St
- 14R Spring St Unit 3
- 26 Marina Dr
- 60 Rocky Neck Ave Unit 202
- 73 Rocky Neck Ave Unit 2
- 191 Main St Unit 3
- 191 Main St Unit 2A
- 19 Trask St Unit 2
- 50 Warner St
- 1 Wonson St
- 10 Seaview Rd
- 113 Pleasant St
- 40 Sargent St
- 70 Old Nugent Farm Rd
- 33 Maplewood Ave Unit 310
Your Personal Tour Guide
Ask me questions while you tour the home.