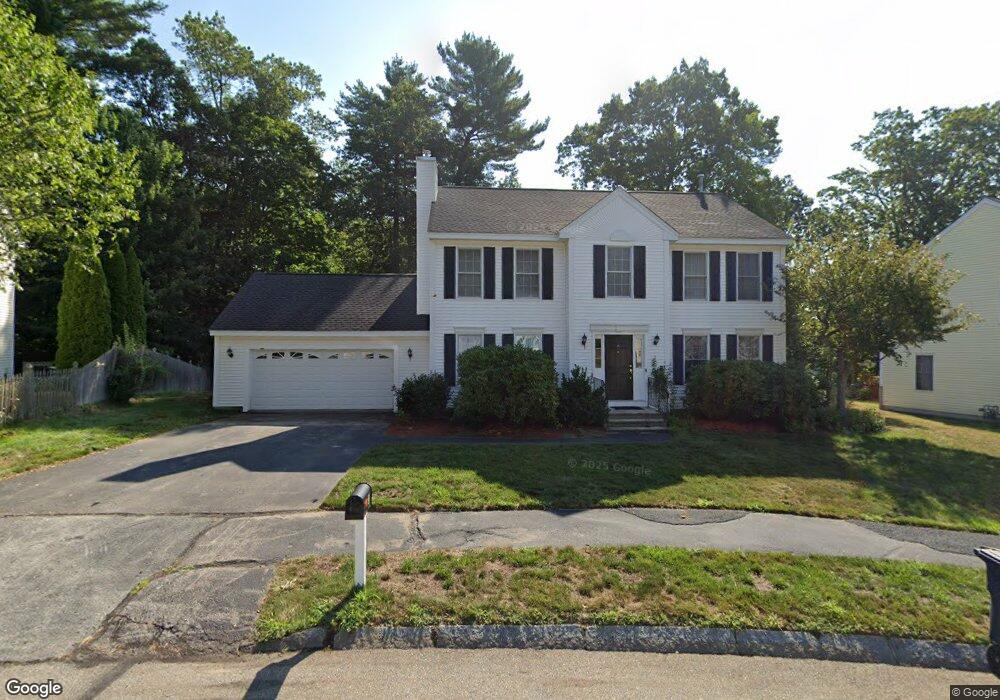
3 Brick Manor Dr Nashua, NH 03063
Northwest Nashua NeighborhoodEstimated Value: $590,000 - $789,000
4
Beds
3
Baths
2,868
Sq Ft
$245/Sq Ft
Est. Value
About This Home
This home is located at 3 Brick Manor Dr, Nashua, NH 03063 and is currently estimated at $702,497, approximately $244 per square foot. 3 Brick Manor Dr is a home located in Hillsborough County with nearby schools including Birch Hill Elementary School, Elm Street Middle School, and Nashua High School North.
Ownership History
Date
Name
Owned For
Owner Type
Purchase Details
Closed on
Jan 21, 2011
Sold by
Linscott Jason E and Linscott Courtney L
Bought by
Ghose Arnab and Dutta Sudeshna
Current Estimated Value
Home Financials for this Owner
Home Financials are based on the most recent Mortgage that was taken out on this home.
Original Mortgage
$311,888
Interest Rate
4.62%
Mortgage Type
Purchase Money Mortgage
Purchase Details
Closed on
Dec 1, 2005
Sold by
Hurst Jennifer D and Hurst Daniel L
Bought by
Linscott Jason E
Purchase Details
Closed on
Jul 29, 2002
Sold by
Crews Albert and Crews Kristin C
Bought by
Hurst Daniel L and Hurst Jennifer D
Purchase Details
Closed on
Jul 27, 2000
Sold by
One Line Rlty Dev Llc
Bought by
Crews Iiird Kristin C and Crews Albert
Purchase Details
Closed on
May 22, 1998
Sold by
Mile High Real Est Llc
Bought by
Gauthier Garry and Gauthier Glenn
Create a Home Valuation Report for This Property
The Home Valuation Report is an in-depth analysis detailing your home's value as well as a comparison with similar homes in the area
Home Values in the Area
Average Home Value in this Area
Purchase History
| Date | Buyer | Sale Price | Title Company |
|---|---|---|---|
| Ghose Arnab | $320,000 | -- | |
| Linscott Jason E | $407,000 | -- | |
| Hurst Daniel L | $315,000 | -- | |
| Crews Iiird Kristin C | $238,200 | -- | |
| Gauthier Garry | $68,000 | -- |
Source: Public Records
Mortgage History
| Date | Status | Borrower | Loan Amount |
|---|---|---|---|
| Open | Gauthier Garry | $293,550 | |
| Closed | Gauthier Garry | $311,888 | |
| Closed | Gauthier Garry | $311,888 |
Source: Public Records
Tax History Compared to Growth
Tax History
| Year | Tax Paid | Tax Assessment Tax Assessment Total Assessment is a certain percentage of the fair market value that is determined by local assessors to be the total taxable value of land and additions on the property. | Land | Improvement |
|---|---|---|---|---|
| 2024 | $11,070 | $696,200 | $170,500 | $525,700 |
| 2023 | $10,522 | $577,200 | $136,500 | $440,700 |
| 2022 | $10,430 | $577,200 | $136,500 | $440,700 |
| 2021 | $9,553 | $411,400 | $100,000 | $311,400 |
| 2020 | $9,302 | $411,400 | $100,000 | $311,400 |
| 2019 | $8,952 | $411,400 | $100,000 | $311,400 |
| 2018 | $8,726 | $411,400 | $100,000 | $311,400 |
| 2017 | $8,947 | $346,900 | $82,400 | $264,500 |
| 2016 | $8,697 | $346,900 | $82,400 | $264,500 |
| 2015 | $8,509 | $346,900 | $82,400 | $264,500 |
| 2014 | $8,343 | $346,900 | $82,400 | $264,500 |
Source: Public Records
Map
Nearby Homes
- 424 Broad St
- 14 Parrish Hill Dr
- 239 Broad St
- 11 Inca Dr
- 36 Hampton Dr
- 6 Cornwall Ln Unit 7
- 5 Meghan Dr Unit U23
- 22 Cathedral Cir
- 3 Richmond St
- 4 Nelson St
- 4 Jared Cir Unit U21
- 5 Chatfield Dr Unit U18
- 27 Country Hill Rd Unit U90
- 19 Dunloggin Rd
- 7 Robert Dr
- 599 W Hollis St
- 334 Broad St
- 46 Scenic Dr
- 76 Bartemus Trail Unit U231
- 8 Althea Ln Unit U26