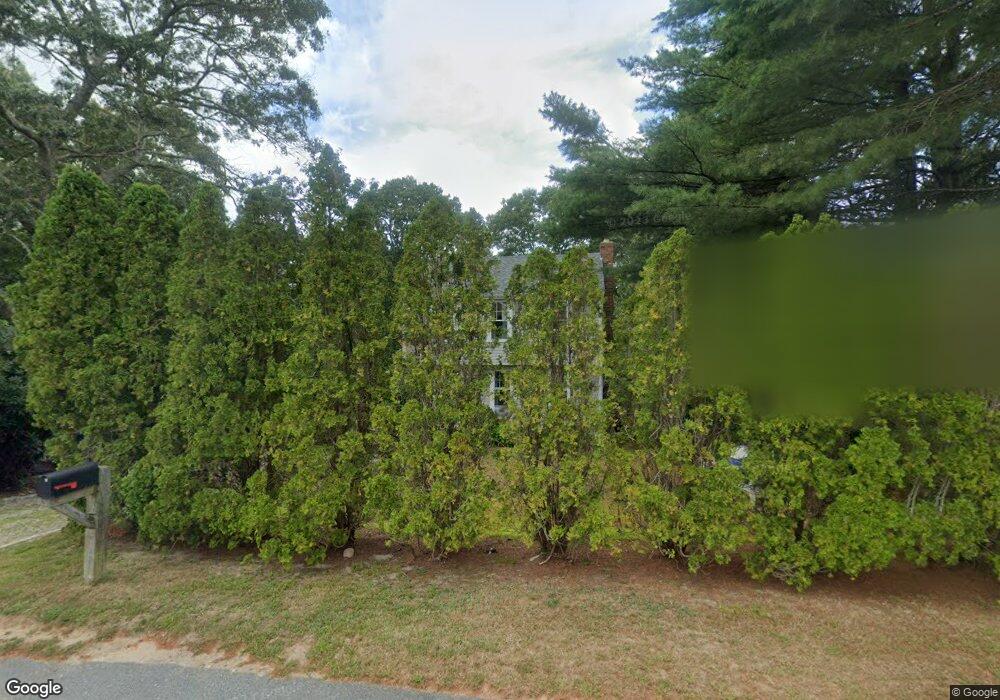
3 Briggs Ave Buzzards Bay, MA 02532
Estimated Value: $462,381 - $514,000
2
Beds
1
Bath
1,056
Sq Ft
$464/Sq Ft
Est. Value
About This Home
This home is located at 3 Briggs Ave, Buzzards Bay, MA 02532 and is currently estimated at $489,845, approximately $463 per square foot. 3 Briggs Ave is a home located in Barnstable County with nearby schools including Bourne High School, Cadence Academy Preschool - Bourne, and St Margaret Regional School.
Ownership History
Date
Name
Owned For
Owner Type
Purchase Details
Closed on
Jun 2, 2011
Sold by
Smith John A
Bought by
Campbell Teague
Current Estimated Value
Home Financials for this Owner
Home Financials are based on the most recent Mortgage that was taken out on this home.
Original Mortgage
$175,437
Outstanding Balance
$113,562
Interest Rate
3.75%
Mortgage Type
FHA
Estimated Equity
$376,283
Create a Home Valuation Report for This Property
The Home Valuation Report is an in-depth analysis detailing your home's value as well as a comparison with similar homes in the area
Purchase History
| Date | Buyer | Sale Price | Title Company |
|---|---|---|---|
| Campbell Teague | $180,000 | -- | |
| Campbell Teague | $180,000 | -- |
Source: Public Records
Mortgage History
| Date | Status | Borrower | Loan Amount |
|---|---|---|---|
| Open | Campbell Teague | $175,437 | |
| Closed | Campbell Teague | $175,437 | |
| Previous Owner | Campbell Teague | $65,000 |
Source: Public Records
Tax History
| Year | Tax Paid | Tax Assessment Tax Assessment Total Assessment is a certain percentage of the fair market value that is determined by local assessors to be the total taxable value of land and additions on the property. | Land | Improvement |
|---|---|---|---|---|
| 2025 | $2,993 | $383,200 | $184,900 | $198,300 |
| 2024 | $2,926 | $364,900 | $176,100 | $188,800 |
| 2023 | $2,845 | $322,900 | $155,800 | $167,100 |
| 2022 | $2,729 | $270,500 | $137,900 | $132,600 |
| 2021 | $2,669 | $247,800 | $125,500 | $122,300 |
| 2020 | $2,585 | $240,700 | $124,300 | $116,400 |
| 2019 | $2,460 | $234,100 | $124,300 | $109,800 |
| 2018 | $2,350 | $223,000 | $118,400 | $104,600 |
| 2017 | $2,016 | $195,700 | $111,400 | $84,300 |
| 2016 | $1,973 | $194,200 | $111,400 | $82,800 |
| 2015 | $1,838 | $182,500 | $99,700 | $82,800 |
Source: Public Records
Map
Nearby Homes
- 20 Colony Ave
- 4 Harbor Hill Dr
- 16 Amberwood Ct
- 12 Turnberry Rd Unit 12
- 203 County Rd
- 4 Hollyhock Knoll Ct Unit 4
- 4 Hollyhock Knoll Ct Unit 4
- 566 Shore Rd
- 5 Sea Knoll Ct
- 13 Laurel Hill Ct
- 3 1st St
- 709 County Rd
- 7 4th Ave
- 3 4th Ave
- 5 Zoli Ln
- 254 Barlows Landing Rd
- 16 Michael Rd
- 14 Navajo Rd
- 44 Cotuit Rd
- 10 Sandy Ln
Your Personal Tour Guide
Ask me questions while you tour the home.