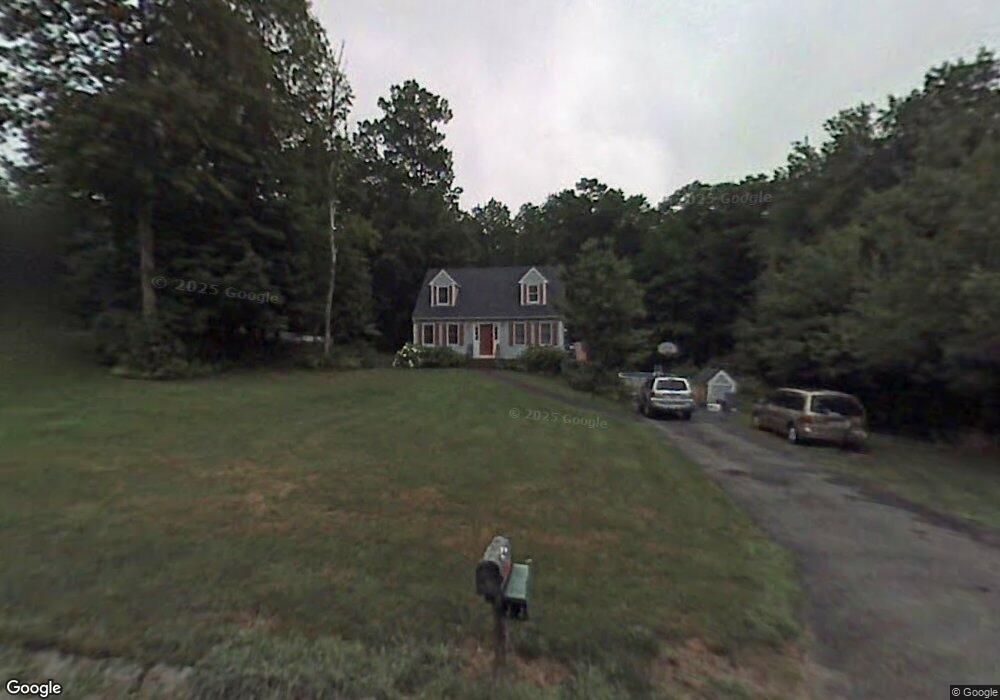
3 Buckhill Rd Tyngsboro, MA 01879
Estimated Value: $615,868 - $772,000
2
Beds
2
Baths
1,344
Sq Ft
$515/Sq Ft
Est. Value
About This Home
This home is located at 3 Buckhill Rd, Tyngsboro, MA 01879 and is currently estimated at $691,717, approximately $514 per square foot. 3 Buckhill Rd is a home located in Middlesex County with nearby schools including Tyngsborough Elementary School, Tyngsborough Middle School, and Tyngsborough High School.
Ownership History
Date
Name
Owned For
Owner Type
Purchase Details
Closed on
May 29, 1992
Sold by
Arrowhead Corp
Bought by
Tuohy Thomas and Tuohy Maura
Current Estimated Value
Home Financials for this Owner
Home Financials are based on the most recent Mortgage that was taken out on this home.
Original Mortgage
$137,750
Interest Rate
8.7%
Mortgage Type
Purchase Money Mortgage
Create a Home Valuation Report for This Property
The Home Valuation Report is an in-depth analysis detailing your home's value as well as a comparison with similar homes in the area
Home Values in the Area
Average Home Value in this Area
Purchase History
| Date | Buyer | Sale Price | Title Company |
|---|---|---|---|
| Tuohy Thomas | $145,000 | -- |
Source: Public Records
Mortgage History
| Date | Status | Borrower | Loan Amount |
|---|---|---|---|
| Open | Tuohy Thomas | $128,000 | |
| Closed | Tuohy Thomas | $17,000 | |
| Closed | Tuohy Thomas | $132,000 | |
| Closed | Tuohy Thomas | $137,750 |
Source: Public Records
Tax History Compared to Growth
Tax History
| Year | Tax Paid | Tax Assessment Tax Assessment Total Assessment is a certain percentage of the fair market value that is determined by local assessors to be the total taxable value of land and additions on the property. | Land | Improvement |
|---|---|---|---|---|
| 2025 | $71 | $576,200 | $273,900 | $302,300 |
| 2024 | $7,001 | $550,400 | $266,900 | $283,500 |
| 2023 | $6,579 | $465,300 | $223,300 | $242,000 |
| 2022 | $6,269 | $419,600 | $195,000 | $224,600 |
| 2021 | $5,183 | $381,300 | $177,600 | $203,700 |
| 2020 | $6,048 | $372,200 | $168,900 | $203,300 |
| 2019 | $11,124 | $348,600 | $160,200 | $188,400 |
| 2018 | $3,588 | $330,800 | $160,200 | $170,600 |
| 2017 | $5,555 | $323,700 | $160,200 | $163,500 |
| 2016 | $5,524 | $314,600 | $160,200 | $154,400 |
| 2015 | $5,025 | $296,300 | $155,800 | $140,500 |
Source: Public Records
Map
Nearby Homes
- 16 Dragonfly Dr
- 31 Sagewood Dr Unit 31
- 61 Sagewood Dr
- 31 Sagewood Dr
- 4 Paradise Ln
- 57 Parham Rd
- 55 Glendale Ave
- 92 Dracut Rd
- 7 Lyons Way
- 123 Musquash Rd
- 20 Birchmont St
- 1 Elm Grove Ave
- 17 Norris Rd
- 23 Chardonnay Rd
- 15 Norris Rd
- 54 Mascuppic Trail
- 30 Walnut St
- 363 Tyngsboro Rd
- 1 Wintergreen Dr
- 79 B St