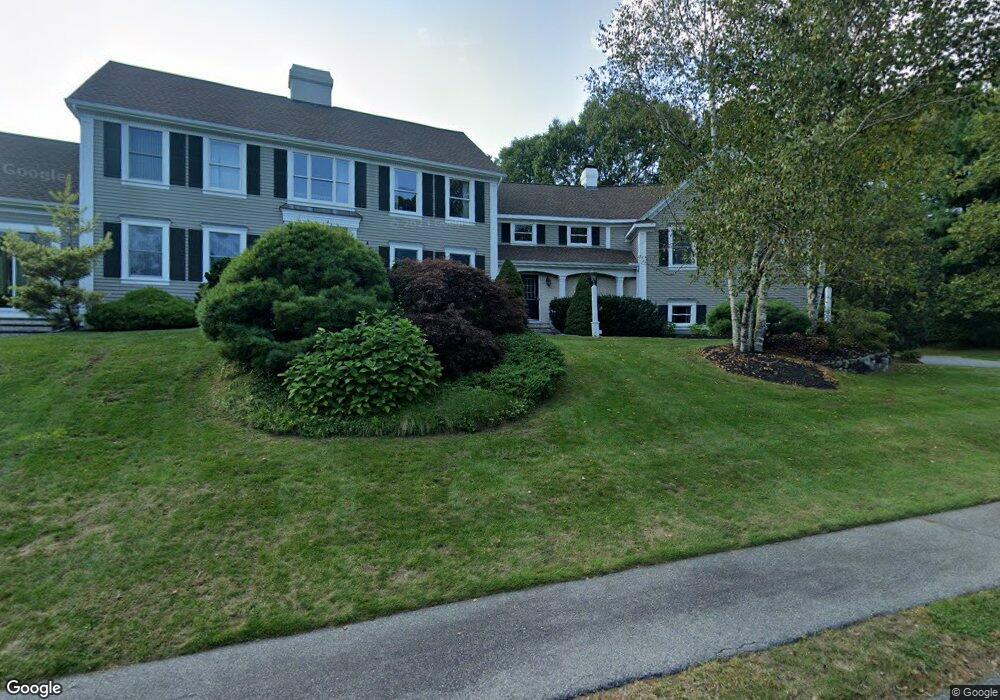
3 Buttonwood Dr Andover, MA 01810
Ballardvale NeighborhoodEstimated Value: $1,899,506 - $2,154,000
5
Beds
4
Baths
5,493
Sq Ft
$366/Sq Ft
Est. Value
About This Home
This home is located at 3 Buttonwood Dr, Andover, MA 01810 and is currently estimated at $2,008,877, approximately $365 per square foot. 3 Buttonwood Dr is a home located in Essex County with nearby schools including Henry C. Sanborn Elementary School, Andover West Middle School, and Andover High School.
Ownership History
Date
Name
Owned For
Owner Type
Purchase Details
Closed on
Jul 12, 2011
Sold by
Barrett David M and Barrett Sibley B
Bought by
Singh Vikram and Singh Namita
Current Estimated Value
Home Financials for this Owner
Home Financials are based on the most recent Mortgage that was taken out on this home.
Original Mortgage
$951,920
Outstanding Balance
$638,910
Interest Rate
4%
Mortgage Type
Purchase Money Mortgage
Estimated Equity
$1,369,967
Purchase Details
Closed on
Aug 31, 1999
Sold by
Ciulla Anthony J and Ciulla Susan C
Bought by
Barrett David M and Barrett Sibley B
Home Financials for this Owner
Home Financials are based on the most recent Mortgage that was taken out on this home.
Original Mortgage
$240,000
Interest Rate
7.53%
Mortgage Type
Purchase Money Mortgage
Purchase Details
Closed on
Jan 30, 1998
Sold by
Fieldstone Meadows Dev
Bought by
Ciulla Anthony J
Create a Home Valuation Report for This Property
The Home Valuation Report is an in-depth analysis detailing your home's value as well as a comparison with similar homes in the area
Home Values in the Area
Average Home Value in this Area
Purchase History
| Date | Buyer | Sale Price | Title Company |
|---|---|---|---|
| Singh Vikram | $1,189,900 | -- | |
| Barrett David M | $869,000 | -- | |
| Ciulla Anthony J | $887,500 | -- | |
| Singh Vikram | $1,189,900 | -- | |
| Barrett David M | $869,000 | -- | |
| Ciulla Anthony J | $887,500 | -- |
Source: Public Records
Mortgage History
| Date | Status | Borrower | Loan Amount |
|---|---|---|---|
| Open | Singh Vikram | $951,920 | |
| Closed | Ciulla Anthony J | $951,920 | |
| Previous Owner | Ciulla Anthony J | $235,820 | |
| Previous Owner | Ciulla Anthony J | $240,000 |
Source: Public Records
Tax History
| Year | Tax Paid | Tax Assessment Tax Assessment Total Assessment is a certain percentage of the fair market value that is determined by local assessors to be the total taxable value of land and additions on the property. | Land | Improvement |
|---|---|---|---|---|
| 2024 | $24,337 | $1,889,500 | $674,300 | $1,215,200 |
| 2023 | $22,926 | $1,678,300 | $576,300 | $1,102,000 |
| 2022 | $21,945 | $1,503,100 | $519,200 | $983,900 |
| 2021 | $21,102 | $1,380,100 | $472,100 | $908,000 |
| 2020 | $20,493 | $1,365,300 | $472,100 | $893,200 |
| 2019 | $21,358 | $1,398,700 | $510,000 | $888,700 |
| 2018 | $20,581 | $1,315,900 | $495,000 | $820,900 |
| 2017 | $19,789 | $1,303,600 | $485,400 | $818,200 |
| 2016 | $19,388 | $1,308,200 | $485,400 | $822,800 |
| 2015 | -- | $1,264,800 | $485,400 | $779,400 |
Source: Public Records
Map
Nearby Homes
- 2 Garfield Ln W
- 72 Tewksbury St
- 18 Dale St Unit 9D
- 6 Hearthstone Place
- 14 Jill's Way Unit 14
- 11 Rennie Dr
- 1 Delisio Dr
- 58 Blanchard St
- 8 Stouffer Cir
- 3 West Hollow
- 14 Geneva Rd
- 11 Wyncrest Cir
- 15 Geneva Rd
- 105 Central St
- 241 Lowell St Unit 3
- 16 Rockingham Dr Unit 131
- 20 Kensington Way Unit 20
- 22 Haggetts Pond Rd
- 56 Sunset Rock Rd
- 31 Porter Rd
- 96 Dascomb Rd
- 1 Buttonwood Dr
- 4 Buttonwood Dr
- 100 Dascomb Rd
- 8 Buttonwood Dr
- 104 Dascomb Rd
- 92 Dascomb Rd
- 5 Buttonwood Dr
- 2 Buttonwood Dr
- 108 Dascomb Rd
- 7 Buttonwood Dr
- 1 Steeple Ct
- 103 Dascomb Rd
- 105 Dascomb Rd Unit 1
- 105 Dascomb Rd Unit 1
- 10 Buttonwood Dr
- 5 Acorn Dr
- 2 Acorn Dr
- 4 Lovejoy Rd
- 29 Buttonwood Dr
Your Personal Tour Guide
Ask me questions while you tour the home.