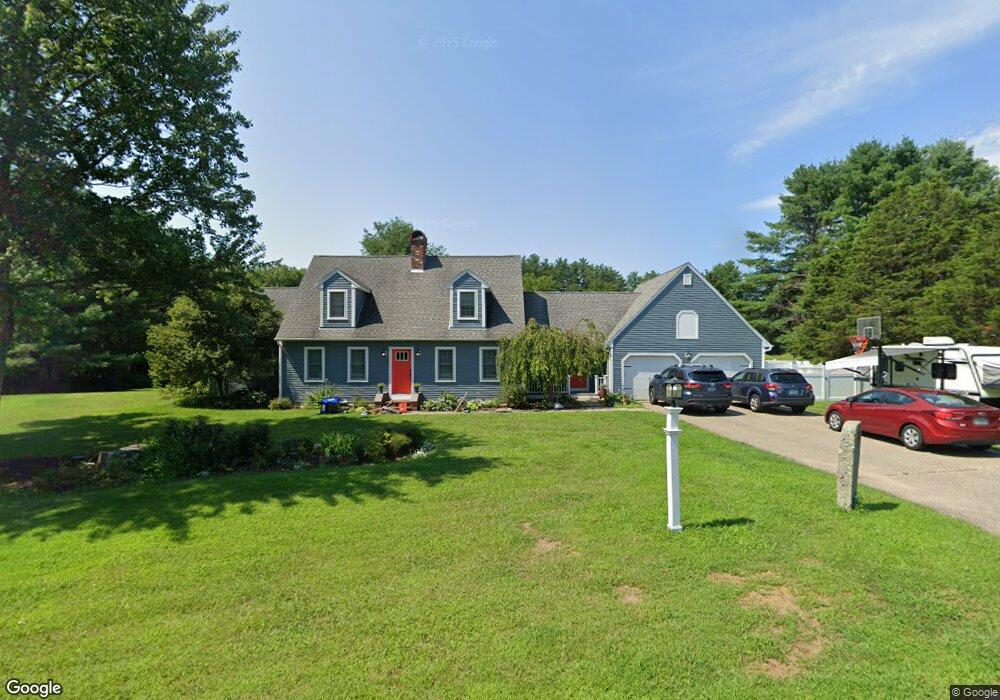
3 Carriage Way Durham, NH 03824
Estimated Value: $782,000 - $888,000
5
Beds
3
Baths
2,843
Sq Ft
$290/Sq Ft
Est. Value
About This Home
This home is located at 3 Carriage Way, Durham, NH 03824 and is currently estimated at $825,240, approximately $290 per square foot. 3 Carriage Way is a home located in Strafford County with nearby schools including Mast Way School, Oyster River Middle School, and Oyster River High School.
Ownership History
Date
Name
Owned For
Owner Type
Purchase Details
Closed on
Oct 10, 2022
Sold by
Curran Anthony L and Rearick-Curran Deborah M
Bought by
Rearick Curran Ret
Current Estimated Value
Purchase Details
Closed on
Feb 27, 2015
Sold by
Abladian Lewis M and Abladian Kathleen E
Bought by
Curran Anthony L and Rearick-Curran Deborah M
Home Financials for this Owner
Home Financials are based on the most recent Mortgage that was taken out on this home.
Original Mortgage
$280,000
Interest Rate
3.66%
Mortgage Type
New Conventional
Purchase Details
Closed on
Dec 4, 2007
Sold by
Wade Steven L and Wade Molly M
Bought by
Abladian Lewis M and Abladian Kathleen E
Home Financials for this Owner
Home Financials are based on the most recent Mortgage that was taken out on this home.
Original Mortgage
$311,200
Interest Rate
6.18%
Mortgage Type
Unknown
Purchase Details
Closed on
Feb 23, 1996
Sold by
Difilippo Frank J
Bought by
Berkeley Federal Bk & and Berkeley Federal Bk
Create a Home Valuation Report for This Property
The Home Valuation Report is an in-depth analysis detailing your home's value as well as a comparison with similar homes in the area
Home Values in the Area
Average Home Value in this Area
Purchase History
| Date | Buyer | Sale Price | Title Company |
|---|---|---|---|
| Rearick Curran Ret | -- | None Available | |
| Curran Anthony L | $415,000 | -- | |
| Abladian Lewis M | $389,000 | -- | |
| Berkeley Federal Bk & | $152,500 | -- |
Source: Public Records
Mortgage History
| Date | Status | Borrower | Loan Amount |
|---|---|---|---|
| Previous Owner | Curran Anthony L | $280,000 | |
| Previous Owner | Curran Anthony L | $289,000 | |
| Previous Owner | Curran Anthony L | $280,000 | |
| Previous Owner | Berkeley Federal Bk & | $300,000 | |
| Previous Owner | Berkeley Federal Bk & | $311,200 | |
| Previous Owner | Berkeley Federal Bk & | $369,555 |
Source: Public Records
Tax History Compared to Growth
Tax History
| Year | Tax Paid | Tax Assessment Tax Assessment Total Assessment is a certain percentage of the fair market value that is determined by local assessors to be the total taxable value of land and additions on the property. | Land | Improvement |
|---|---|---|---|---|
| 2024 | $13,757 | $676,700 | $209,500 | $467,200 |
| 2023 | $13,859 | $676,700 | $209,500 | $467,200 |
| 2022 | $12,705 | $437,500 | $140,000 | $297,500 |
| 2021 | $12,211 | $437,500 | $140,000 | $297,500 |
| 2020 | $6,522 | $437,500 | $140,000 | $297,500 |
| 2019 | $12,001 | $437,500 | $140,000 | $297,500 |
| 2018 | $1,968 | $434,800 | $140,000 | $294,800 |
| 2017 | $12,452 | $406,400 | $126,000 | $280,400 |
| 2016 | $3,273 | $435,500 | $126,000 | $309,500 |
| 2015 | $12,239 | $410,000 | $126,000 | $284,000 |
| 2014 | $12,513 | $410,000 | $126,000 | $284,000 |
| 2013 | $12,273 | $403,600 | $126,000 | $277,600 |
Source: Public Records
Map
Nearby Homes
- 1 Carriage Way
- 5 Carriage Way
- 6 Carriage Way
- 8 Carriage Way
- 4 Carriage Way
- 331 Packers Falls Rd
- 2 Carriage Way
- 321 Packers Falls Rd
- 7 Carriage Way
- 9 Carriage Way
- 10 Carriage Way
- 2 Griffiths Dr
- 4 Griffiths Dr
- 4 Griffiths Dr
- 1 Griffiths Dr
- 5 Griffiths Dr
- 5 Griffiths Dr
- 4 Surrey Ln
- 2 Surrey Ln
- 309 Packers Falls Rd