
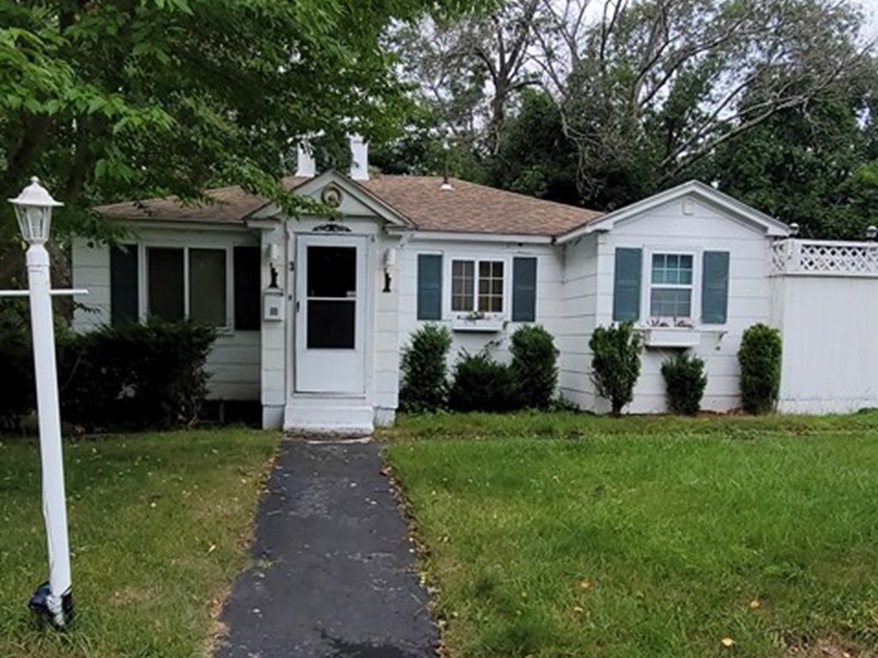
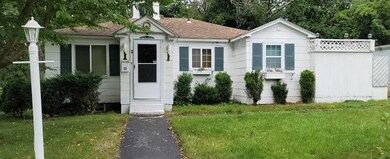
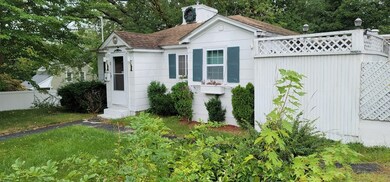
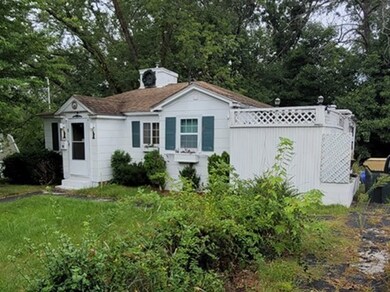
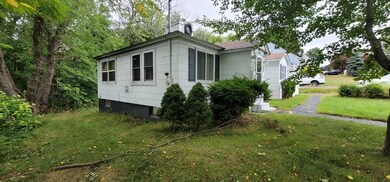
3 Carroll St Auburn, MA 01501
Stoneville Neighborhood
2
Beds
1
Bath
808
Sq Ft
7,841
Sq Ft Lot
About This Home
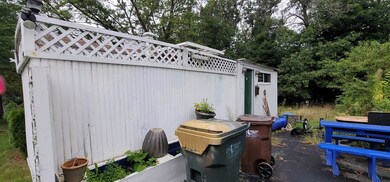
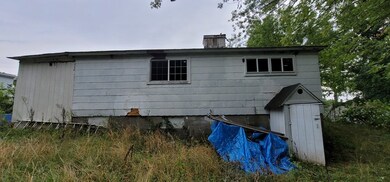
As of July 2021***HIGHEST & BEST DUE MONDAY 8/31/2020 BY 12PM*** ATTENTION INVESTORS!! Contractors Looking for YOUR Next Project! Great Location, Commuters Dream! Close to everything, HIDDEN GEM!! Bring this Property back to life! Newer roof, and Windows! So much potential! Great Bones! Large Kitchen, large bedrooms, hardwood floors! Private Yard! Home feels Larger than it looks!
Home Details
Home Type
- Single Family
Est. Annual Taxes
- $48
Year Built
- Built in 1950
Lot Details
- Property is zoned RA
Flooring
- Wood
- Vinyl
Utilities
- Window Unit Cooling System
- Electric Water Heater
Additional Features
- Basement
Listing and Financial Details
- Assessor Parcel Number M:0004 L:0176
Ownership History
Date
Name
Owned For
Owner Type
Purchase Details
Listed on
May 14, 2021
Closed on
Jul 20, 2021
Sold by
Scola Lorraine A
Bought by
Elmes William and Frazer Denise
Seller's Agent
Kim German
Quinsigamond Realty
Buyer's Agent
Colleen Crowley
Lamacchia Realty, Inc.
List Price
$314,900
Sold Price
$320,000
Premium/Discount to List
$5,100
1.62%
Current Estimated Value
Home Financials for this Owner
Home Financials are based on the most recent Mortgage that was taken out on this home.
Estimated Appreciation
$49,196
Avg. Annual Appreciation
3.18%
Original Mortgage
$230,000
Outstanding Balance
$211,384
Interest Rate
2.9%
Mortgage Type
Purchase Money Mortgage
Estimated Equity
$151,294
Purchase Details
Listed on
Aug 28, 2020
Closed on
Oct 21, 2020
Sold by
Savers Coop Bank
Bought by
Scola Lorraine A
Seller's Agent
Lori Berry
The Neighborhood Realty Group
Buyer's Agent
Michael Madulka
Quinsigamond Realty
List Price
$120,000
Sold Price
$155,000
Premium/Discount to List
$35,000
29.17%
Home Financials for this Owner
Home Financials are based on the most recent Mortgage that was taken out on this home.
Avg. Annual Appreciation
185.93%
Purchase Details
Closed on
Apr 17, 2007
Sold by
Lee Michael J and Lee Sandra J
Bought by
Lee Scott T
Home Financials for this Owner
Home Financials are based on the most recent Mortgage that was taken out on this home.
Original Mortgage
$95,000
Interest Rate
6.24%
Mortgage Type
Purchase Money Mortgage
Similar Home in Auburn, MA
Create a Home Valuation Report for This Property
The Home Valuation Report is an in-depth analysis detailing your home's value as well as a comparison with similar homes in the area
Home Values in the Area
Average Home Value in this Area
Purchase History
| Date | Type | Sale Price | Title Company |
|---|---|---|---|
| Not Resolvable | $320,000 | None Available | |
| Not Resolvable | $155,000 | None Available | |
| Deed | $80,000 | -- |
Source: Public Records
Mortgage History
| Date | Status | Loan Amount | Loan Type |
|---|---|---|---|
| Open | $230,000 | Purchase Money Mortgage | |
| Previous Owner | $24,000 | Stand Alone Refi Refinance Of Original Loan | |
| Previous Owner | $118,400 | Stand Alone Refi Refinance Of Original Loan | |
| Previous Owner | $120,000 | No Value Available | |
| Previous Owner | $25,000 | No Value Available | |
| Previous Owner | $95,000 | Purchase Money Mortgage |
Source: Public Records
Property History
| Date | Event | Price | Change | Sq Ft Price |
|---|---|---|---|---|
| 07/20/2021 07/20/21 | Sold | $320,000 | +1.6% | $345 / Sq Ft |
| 06/18/2021 06/18/21 | Pending | -- | -- | -- |
| 06/14/2021 06/14/21 | For Sale | $314,900 | -1.6% | $339 / Sq Ft |
| 06/08/2021 06/08/21 | Off Market | $320,000 | -- | -- |
| 05/25/2021 05/25/21 | Pending | -- | -- | -- |
| 05/14/2021 05/14/21 | For Sale | $314,900 | +103.2% | $339 / Sq Ft |
| 11/10/2020 11/10/20 | Sold | $155,000 | +29.2% | $192 / Sq Ft |
| 08/31/2020 08/31/20 | Pending | -- | -- | -- |
| 08/28/2020 08/28/20 | For Sale | $120,000 | -- | $149 / Sq Ft |
Source: MLS Property Information Network (MLS PIN)
Tax History Compared to Growth
Tax History
| Year | Tax Paid | Tax Assessment Tax Assessment Total Assessment is a certain percentage of the fair market value that is determined by local assessors to be the total taxable value of land and additions on the property. | Land | Improvement |
|---|---|---|---|---|
| 2025 | $48 | $332,600 | $122,500 | $210,100 |
| 2024 | $4,642 | $310,900 | $115,800 | $195,100 |
| 2023 | $4,465 | $281,200 | $105,200 | $176,000 |
| 2022 | $4,203 | $249,900 | $105,200 | $144,700 |
| 2021 | $3,291 | $181,400 | $92,900 | $88,500 |
| 2020 | $3,242 | $180,300 | $92,900 | $87,400 |
| 2019 | $3,330 | $170,900 | $91,900 | $79,000 |
| 2018 | $2,886 | $156,500 | $86,000 | $70,500 |
| 2017 | $2,723 | $148,500 | $78,000 | $70,500 |
| 2016 | $2,654 | $146,700 | $80,700 | $66,000 |
| 2015 | $2,537 | $147,000 | $80,700 | $66,300 |
| 2014 | $2,403 | $139,000 | $76,900 | $62,100 |
Source: Public Records
Agents Affiliated with this Home
-
K
Seller's Agent in 2021
Kim German
Quinsigamond Realty
-
Colleen Crowley
Buyer's Agent in 2021
Colleen Crowley
Lamacchia Realty, Inc.
(774) 275-0720
3 in this area
137 Total Sales
-
Lori Berry
L
Seller's Agent in 2020
Lori Berry
The Neighborhood Realty Group
(508) 277-7492
1 in this area
63 Total Sales
-
Michael Madulka
Buyer's Agent in 2020
Michael Madulka
Quinsigamond Realty
(508) 579-7777
4 in this area
77 Total Sales
Map
Source: MLS Property Information Network (MLS PIN)
MLS Number: 72717147
APN: AUBU-000004-000000-000176
Disclaimer: Certain information contained herein is derived from information provided by parties other than Homes.com. All information provided is deemed reliable, but is not guaranteed to be accurate and should be independently verified.
![]() The property listing data and information, or the Images, set forth herein were provided to MLS Property Information Network, Inc. from third party sources, including sellers, lessors and public records, and were compiled by MLS Property Information Network, Inc. The property listing data and information, and the Images, are for the personal, non-commercial use of consumers having a good faith interest in purchasing or leasing listed properties of the type displayed to them and may not be used for any purpose other than to identify prospective properties which such consumers may have a good faith interest in purchasing or leasing. MLS Property Information Network, Inc. and its subscribers disclaim any and all representations and warranties as to the accuracy of the property listing data and information, or as to the accuracy of any of the Images, set forth herein.
The property listing data and information, or the Images, set forth herein were provided to MLS Property Information Network, Inc. from third party sources, including sellers, lessors and public records, and were compiled by MLS Property Information Network, Inc. The property listing data and information, and the Images, are for the personal, non-commercial use of consumers having a good faith interest in purchasing or leasing listed properties of the type displayed to them and may not be used for any purpose other than to identify prospective properties which such consumers may have a good faith interest in purchasing or leasing. MLS Property Information Network, Inc. and its subscribers disclaim any and all representations and warranties as to the accuracy of the property listing data and information, or as to the accuracy of any of the Images, set forth herein.
Nearby Homes