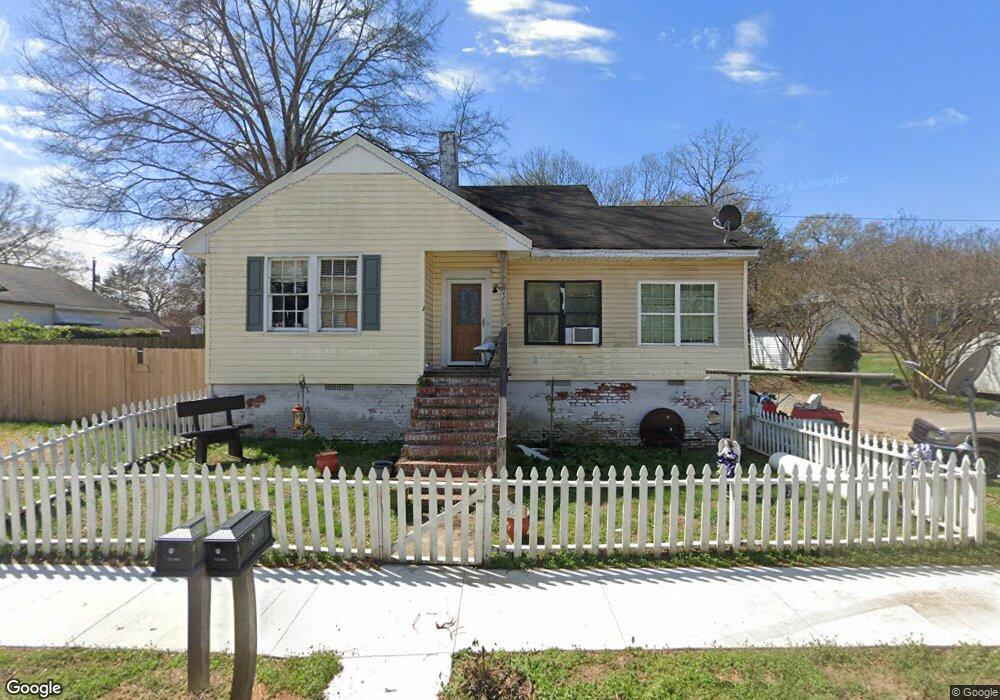
3 Crescent St SE Lindale, GA 30147
Estimated Value: $165,383 - $196,000
--
Bed
--
Bath
1,395
Sq Ft
$130/Sq Ft
Est. Value
About This Home
This home is located at 3 Crescent St SE, Lindale, GA 30147 and is currently estimated at $181,596, approximately $130 per square foot. 3 Crescent St SE is a home located in Floyd County with nearby schools including Pepperell Middle School, Pepperell High School, and Montessori School of Rome.
Ownership History
Date
Name
Owned For
Owner Type
Purchase Details
Closed on
Nov 26, 2018
Sold by
Br & K Family Limited Partnership
Bought by
Ingram Debra
Current Estimated Value
Purchase Details
Closed on
Oct 9, 1997
Sold by
Jordan Sheila Fay
Bought by
Timms Billy
Purchase Details
Closed on
Jul 9, 1996
Bought by
P and R
Purchase Details
Closed on
Mar 12, 1991
Sold by
Brock Sheila Fay
Bought by
Jordan Sheila Fay
Purchase Details
Closed on
Aug 28, 1985
Bought by
P and R
Purchase Details
Closed on
Feb 22, 1985
Sold by
Brock William S and Sheila Fay
Bought by
Brock Sheila Fay
Purchase Details
Closed on
Mar 11, 1981
Sold by
Jordon James H and Jordon June B
Bought by
Brock William S and Sheila Fay
Purchase Details
Closed on
Sep 15, 1978
Sold by
Terry Chas E
Bought by
Jordon James H and Jordon June B
Purchase Details
Closed on
Apr 8, 1976
Sold by
Beard Harry Daniel
Bought by
Terry Chas E
Purchase Details
Closed on
May 21, 1969
Sold by
Jr Pruitt
Bought by
Beard Harry Daniel
Purchase Details
Closed on
Jan 1, 1901
Bought by
Jr Pruitt
Create a Home Valuation Report for This Property
The Home Valuation Report is an in-depth analysis detailing your home's value as well as a comparison with similar homes in the area
Home Values in the Area
Average Home Value in this Area
Purchase History
| Date | Buyer | Sale Price | Title Company |
|---|---|---|---|
| Ingram Debra | $80,000 | -- | |
| Br & K Family Limited Partnership | -- | -- | |
| Timms Billy | $45,000 | -- | |
| P | -- | -- | |
| Jordan Sheila Fay | -- | -- | |
| P | -- | -- | |
| Brock Sheila Fay | -- | -- | |
| Brock William S | $21,400 | -- | |
| Jordon James H | $21,000 | -- | |
| Terry Chas E | $22,000 | -- | |
| Beard Harry Daniel | $7,000 | -- | |
| Jr Pruitt | -- | -- |
Source: Public Records
Tax History Compared to Growth
Tax History
| Year | Tax Paid | Tax Assessment Tax Assessment Total Assessment is a certain percentage of the fair market value that is determined by local assessors to be the total taxable value of land and additions on the property. | Land | Improvement |
|---|---|---|---|---|
| 2024 | $1,666 | $56,190 | $5,745 | $50,445 |
| 2023 | $1,682 | $50,758 | $5,106 | $45,652 |
| 2022 | $1,295 | $41,117 | $4,149 | $36,968 |
| 2021 | $1,183 | $36,776 | $4,149 | $32,627 |
| 2020 | $1,093 | $33,616 | $3,192 | $30,424 |
| 2019 | $982 | $30,534 | $3,192 | $27,342 |
| 2018 | $919 | $28,467 | $3,192 | $25,275 |
| 2017 | $882 | $27,183 | $3,192 | $23,991 |
| 2016 | $914 | $27,880 | $3,160 | $24,720 |
| 2015 | $880 | $27,880 | $3,160 | $24,720 |
| 2014 | $880 | $27,880 | $3,160 | $24,720 |
Source: Public Records
Map
Nearby Homes
- 1 Van Tassel Dr SE
- 13 N Terrace Ave SE
- 311 Park Ave SE
- 305 Grove Ave SE
- 608 Eden Valley Rd SE
- 6 Hillside Ave SE
- 0 Edenfield Dr SE Unit 21222627
- 280 Ravenwood Dr SE
- 6 Brooke Ct SE
- 4 Brooke Ct
- 1 Longbrooke Dr SE
- 0 Fullbright Dr SE Unit 10531900
- 0 Fullbright Dr SE Unit 7587938
- 413 Blackberry Ln SE
- The Benson II Plan at Longbrooke
- 106 Sunset Dr SE
- 27 Hughes Dairy Rd SE
- 270 N Edenfield Ridge Dr SE
- 13 Spring Cir SE
- 1572 Booze Mountain Rd SE
- 1 N Central Ave SE
- 1 Crescent St SE
- 17 N Central Ave SE
- 19 N Central Ave SE
- 4 N Central Ave SE
- 3 S 2nd St SE
- 6 N Central Ave SE
- 5 S 2nd St SE
- 2 N Central Ave SE
- 1 S 2nd St SE
- N N Central Ave SE Unit 183
- N N Central Ave SE
- 15 N Central Ave SE
- 7 S 2nd St SE
- 18 N Central Ave SE
- 7 N Terrace Ave SE
- 8 N Central Ave SE
- 3 N Terrace Ave SE
- 3 N Terrace Ave SE Unit 193
- 9 S 2nd St SE