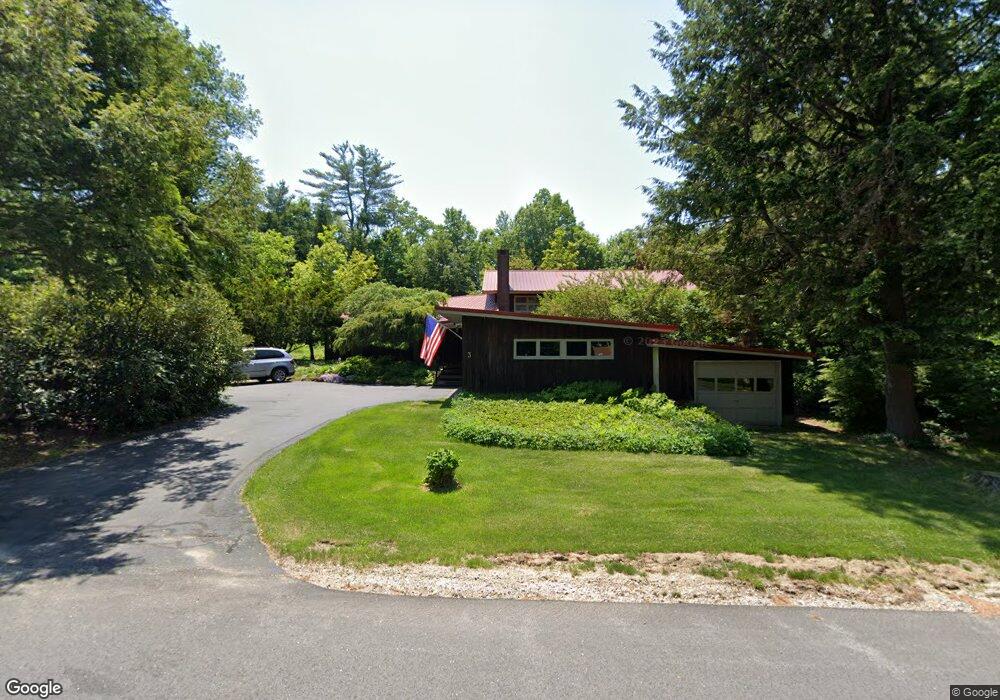
3 Dartmouth Ln Rochester, NH 03867
Estimated Value: $526,000 - $632,000
3
Beds
5
Baths
2,918
Sq Ft
$196/Sq Ft
Est. Value
About This Home
This home is located at 3 Dartmouth Ln, Rochester, NH 03867 and is currently estimated at $571,592, approximately $195 per square foot. 3 Dartmouth Ln is a home located in Strafford County with nearby schools including Chamberlain Street School, Rochester Middle School, and Spaulding High School.
Ownership History
Date
Name
Owned For
Owner Type
Purchase Details
Closed on
Jun 30, 1997
Sold by
Kendall Kennett R and Kendall Patricia C
Bought by
Harrington Brenda B and Harrington Clayton C
Current Estimated Value
Home Financials for this Owner
Home Financials are based on the most recent Mortgage that was taken out on this home.
Original Mortgage
$55,000
Interest Rate
7.81%
Create a Home Valuation Report for This Property
The Home Valuation Report is an in-depth analysis detailing your home's value as well as a comparison with similar homes in the area
Home Values in the Area
Average Home Value in this Area
Purchase History
| Date | Buyer | Sale Price | Title Company |
|---|---|---|---|
| Harrington Brenda B | $135,000 | -- |
Source: Public Records
Mortgage History
| Date | Status | Borrower | Loan Amount |
|---|---|---|---|
| Open | Harrington Brenda B | $90,000 | |
| Closed | Harrington Brenda B | $55,000 |
Source: Public Records
Tax History Compared to Growth
Tax History
| Year | Tax Paid | Tax Assessment Tax Assessment Total Assessment is a certain percentage of the fair market value that is determined by local assessors to be the total taxable value of land and additions on the property. | Land | Improvement |
|---|---|---|---|---|
| 2024 | $7,816 | $526,300 | $145,600 | $380,700 |
| 2023 | $7,308 | $283,900 | $68,500 | $215,400 |
| 2022 | $7,177 | $283,900 | $68,500 | $215,400 |
| 2021 | $6,998 | $283,900 | $68,500 | $215,400 |
| 2020 | $7,019 | $285,200 | $68,500 | $216,700 |
| 2019 | $7,101 | $285,200 | $68,500 | $216,700 |
| 2018 | $6,685 | $242,900 | $46,000 | $196,900 |
| 2017 | $6,396 | $242,900 | $46,000 | $196,900 |
| 2016 | $5,833 | $206,400 | $46,000 | $160,400 |
| 2015 | $5,810 | $206,400 | $46,000 | $160,400 |
| 2014 | $5,670 | $206,400 | $46,000 | $160,400 |
| 2013 | $7,246 | $274,900 | $61,400 | $213,500 |
| 2012 | $7,059 | $274,900 | $61,400 | $213,500 |
Source: Public Records
Map
Nearby Homes
- 3 Dodge St
- 18 Brookfield Dr
- 38 Western Ave
- 15 Linden St
- 161 Lowell St
- 63 Royal Crest Park
- 1 Farrington St
- 32 Adams Ave
- 35 Franklin Heights
- 0 Franklin St Unit 55 4959653
- 56 Chamberlain St
- 7 Mcintire Ct
- 67 Winter St
- 17 Winter St
- 22 Corson St
- 10 Sarah Ct
- 45 Hanson St
- 47 Hanson St
- 57 Congress St
- 9 Weeping Willow Dr