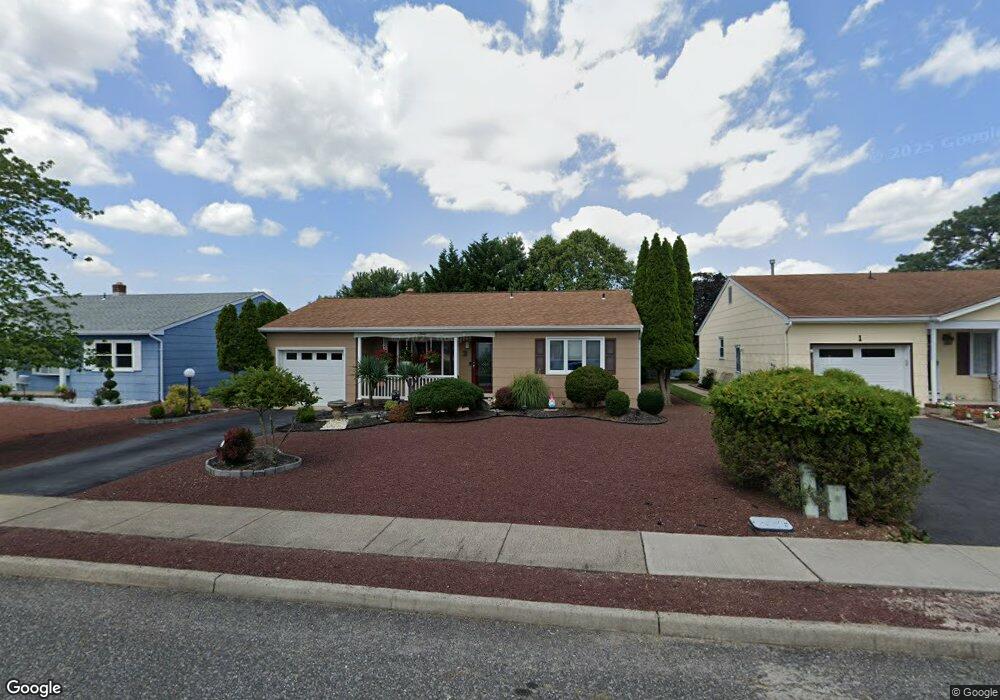
3 Duxbury Rd Toms River, NJ 08757
Estimated Value: $290,314 - $331,000
2
Beds
2
Baths
1,153
Sq Ft
$267/Sq Ft
Est. Value
About This Home
This home is located at 3 Duxbury Rd, Toms River, NJ 08757 and is currently estimated at $308,329, approximately $267 per square foot. 3 Duxbury Rd is a home located in Ocean County with nearby schools including Central Regional Middle School and Central Regional High School.
Ownership History
Date
Name
Owned For
Owner Type
Purchase Details
Closed on
May 15, 2001
Sold by
Petrucelli Joseph
Bought by
Surinski Paul and Surinski Sandra
Current Estimated Value
Home Financials for this Owner
Home Financials are based on the most recent Mortgage that was taken out on this home.
Original Mortgage
$76,800
Outstanding Balance
$28,677
Interest Rate
7.03%
Estimated Equity
$279,652
Purchase Details
Closed on
May 14, 2001
Sold by
Santaniello Gertrude
Bought by
Petrucelli Joseph and Petrucelli Judith
Home Financials for this Owner
Home Financials are based on the most recent Mortgage that was taken out on this home.
Original Mortgage
$76,800
Outstanding Balance
$28,677
Interest Rate
7.03%
Estimated Equity
$279,652
Purchase Details
Closed on
May 31, 1994
Sold by
Honan Maria
Bought by
Santaniello Gertrude
Create a Home Valuation Report for This Property
The Home Valuation Report is an in-depth analysis detailing your home's value as well as a comparison with similar homes in the area
Home Values in the Area
Average Home Value in this Area
Purchase History
| Date | Buyer | Sale Price | Title Company |
|---|---|---|---|
| Surinski Paul | $195,000 | -- | |
| Surinski Paul | $195,000 | -- | |
| Petrucelli Joseph | $96,000 | -- | |
| Petrucelli Joseph | $96,000 | -- | |
| Santaniello Gertrude | $83,000 | -- |
Source: Public Records
Mortgage History
| Date | Status | Borrower | Loan Amount |
|---|---|---|---|
| Open | Petrucelli Joseph | $76,800 | |
| Closed | Petrucelli Joseph | $76,800 |
Source: Public Records
Tax History Compared to Growth
Tax History
| Year | Tax Paid | Tax Assessment Tax Assessment Total Assessment is a certain percentage of the fair market value that is determined by local assessors to be the total taxable value of land and additions on the property. | Land | Improvement |
|---|---|---|---|---|
| 2025 | $2,775 | $115,100 | $30,000 | $85,100 |
| 2024 | $2,670 | $115,100 | $30,000 | $85,100 |
| 2023 | $2,621 | $115,100 | $30,000 | $85,100 |
| 2022 | $2,621 | $115,100 | $30,000 | $85,100 |
| 2021 | $2,434 | $115,100 | $30,000 | $85,100 |
| 2020 | $2,566 | $115,100 | $30,000 | $85,100 |
| 2019 | $2,494 | $115,100 | $30,000 | $85,100 |
| 2018 | $2,486 | $115,100 | $30,000 | $85,100 |
| 2017 | $2,394 | $115,100 | $30,000 | $85,100 |
| 2016 | $2,381 | $115,100 | $30,000 | $85,100 |
| 2015 | $2,316 | $115,100 | $30,000 | $85,100 |
| 2014 | $2,250 | $115,100 | $30,000 | $85,100 |
Source: Public Records
Map
Nearby Homes
- 6 Westport Dr
- 12 Oakfield Rd
- 48 Nostrand Dr
- 9 Walnut Unit D
- 8 Cedar St Unit D
- 34 Westport Dr
- 128 Westport Dr
- 38 Whitmore Dr
- 55 Whitmore Dr
- 9 Harmony Rd
- 37 Brookfield Ct
- 33 Brookfield Ct
- 41 Nostrand Dr
- 32 Castleton Dr
- 24 Rutland Dr
- 6 Fairfield Rd
- 11 Whitaker Dr
- 16 Manassas Dr
- 23 Burlington Ct
- 13 Millbrook Ct