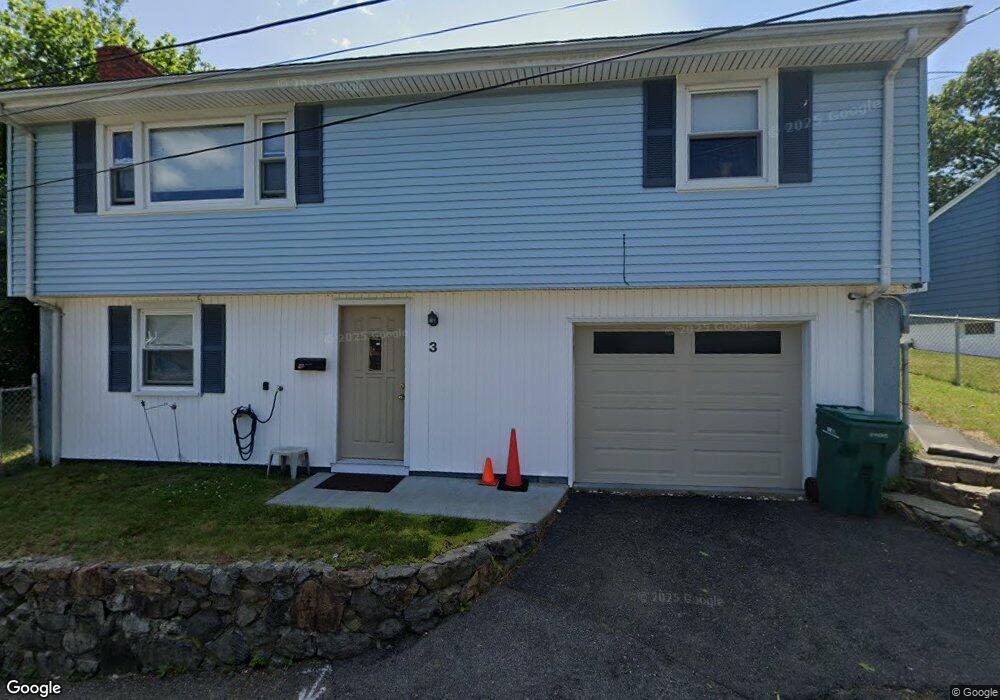
3 E Highland St Lynn, MA 01902
Lynn English NeighborhoodEstimated Value: $448,000 - $592,000
2
Beds
1
Bath
999
Sq Ft
$521/Sq Ft
Est. Value
About This Home
This home is located at 3 E Highland St, Lynn, MA 01902 and is currently estimated at $520,952, approximately $521 per square foot. 3 E Highland St is a home located in Essex County with nearby schools including Robert L. Ford Elementary School, William R. Fallon School, and Marshall Middle School.
Ownership History
Date
Name
Owned For
Owner Type
Purchase Details
Closed on
Nov 13, 2024
Sold by
Cugno Marsha A
Bought by
Cugno Marsha A and Sabanty Marlene
Current Estimated Value
Purchase Details
Closed on
Jun 25, 1986
Bought by
Cugno Marsha A
Create a Home Valuation Report for This Property
The Home Valuation Report is an in-depth analysis detailing your home's value as well as a comparison with similar homes in the area
Home Values in the Area
Average Home Value in this Area
Purchase History
| Date | Buyer | Sale Price | Title Company |
|---|---|---|---|
| Cugno Marsha A | -- | None Available | |
| Cugno Marsha A | -- | None Available | |
| Cugno Marsha A | -- | None Available | |
| Cugno Marsha A | -- | None Available | |
| Cugno Marsha A | $128,000 | -- |
Source: Public Records
Mortgage History
| Date | Status | Borrower | Loan Amount |
|---|---|---|---|
| Previous Owner | Cugno Marsha A | $70,748 | |
| Previous Owner | Cugno Marsha A | $50,000 | |
| Previous Owner | Cugno Marsha A | $106,000 |
Source: Public Records
Tax History Compared to Growth
Tax History
| Year | Tax Paid | Tax Assessment Tax Assessment Total Assessment is a certain percentage of the fair market value that is determined by local assessors to be the total taxable value of land and additions on the property. | Land | Improvement |
|---|---|---|---|---|
| 2025 | $5,221 | $504,000 | $203,800 | $300,200 |
| 2024 | $4,637 | $440,400 | $183,900 | $256,500 |
| 2023 | $4,526 | $405,900 | $183,900 | $222,000 |
| 2022 | $4,092 | $329,200 | $157,900 | $171,300 |
| 2021 | $4,101 | $314,700 | $137,200 | $177,500 |
| 2020 | $3,737 | $278,900 | $107,200 | $171,700 |
| 2019 | $3,882 | $271,500 | $104,500 | $167,000 |
| 2018 | $3,725 | $245,900 | $101,000 | $144,900 |
| 2017 | $3,257 | $208,800 | $78,500 | $130,300 |
| 2016 | $3,097 | $191,400 | $66,200 | $125,200 |
| 2015 | $3,038 | $181,400 | $67,500 | $113,900 |
Source: Public Records
Map
Nearby Homes
- 16 Hollingsworth St
- 30 Adams St
- 106 Goodridge St
- 94 Sheridan St
- 12 Chestnut Ave
- 14 Mount Pleasant Place
- 44 Eutaw Ave
- 69 Hawthorne St
- 6A Goodridge St
- 27-29 Graves Ave
- 325 Western Ave
- 344 Essex St
- 249 Chatham St
- 14 Jewetts Ct
- 431-433 Chatham St
- 199 Allen Ave
- 6-8 Beede Ave
- 440 Essex St
- 29 Ford St
- 32 Clarendon Ave