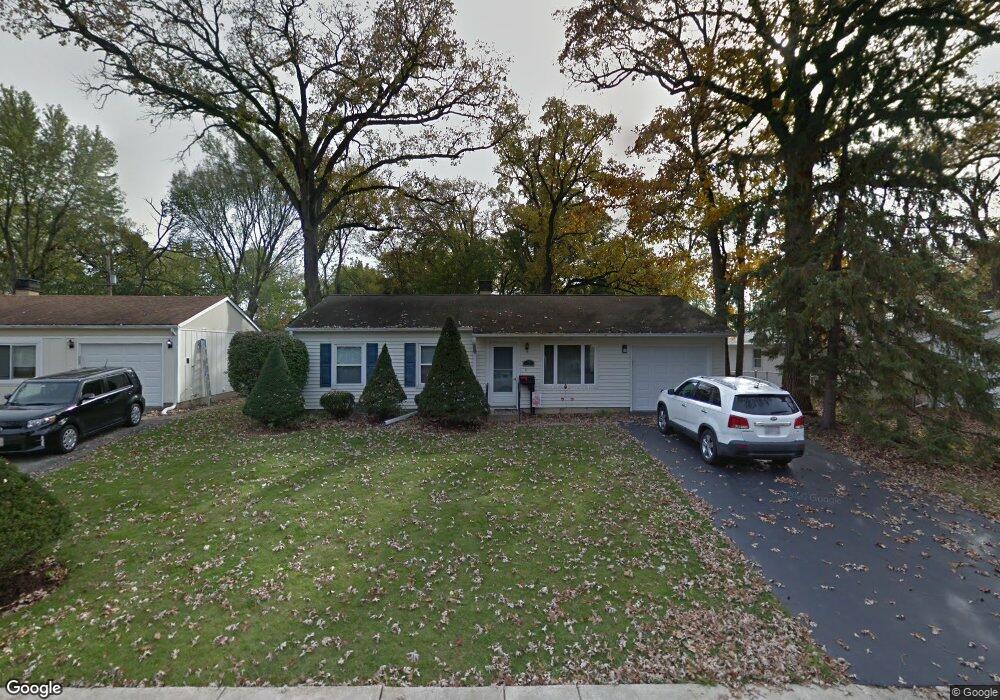
3 E Pine St Streamwood, IL 60107
Woodland Heights NeighborhoodEstimated Value: $271,000 - $299,000
3
Beds
2
Baths
1,060
Sq Ft
$273/Sq Ft
Est. Value
About This Home
This home is located at 3 E Pine St, Streamwood, IL 60107 and is currently estimated at $289,875, approximately $273 per square foot. 3 E Pine St is a home located in Cook County with nearby schools including Oakhill Elementary School, Canton Middle School, and Streamwood High School.
Ownership History
Date
Name
Owned For
Owner Type
Purchase Details
Closed on
Aug 11, 2017
Sold by
Krahn Nancy L
Bought by
Necastro Brian T and Murphy Lisa K
Current Estimated Value
Home Financials for this Owner
Home Financials are based on the most recent Mortgage that was taken out on this home.
Original Mortgage
$167,200
Outstanding Balance
$137,834
Interest Rate
3.96%
Mortgage Type
New Conventional
Estimated Equity
$152,041
Purchase Details
Closed on
Apr 4, 2002
Sold by
James Grace S
Bought by
James Grace S and Grace S James Revocable Trust
Create a Home Valuation Report for This Property
The Home Valuation Report is an in-depth analysis detailing your home's value as well as a comparison with similar homes in the area
Home Values in the Area
Average Home Value in this Area
Purchase History
| Date | Buyer | Sale Price | Title Company |
|---|---|---|---|
| Necastro Brian T | $176,000 | First American Title | |
| James Grace S | -- | -- |
Source: Public Records
Mortgage History
| Date | Status | Borrower | Loan Amount |
|---|---|---|---|
| Open | Necastro Brian T | $167,200 |
Source: Public Records
Tax History
| Year | Tax Paid | Tax Assessment Tax Assessment Total Assessment is a certain percentage of the fair market value that is determined by local assessors to be the total taxable value of land and additions on the property. | Land | Improvement |
|---|---|---|---|---|
| 2025 | $5,447 | $25,000 | $5,101 | $19,899 |
| 2024 | $5,447 | $21,001 | $3,644 | $17,357 |
| 2023 | $5,273 | $21,001 | $3,644 | $17,357 |
| 2022 | $5,273 | $21,001 | $3,644 | $17,357 |
| 2021 | $4,362 | $15,263 | $2,550 | $12,713 |
| 2020 | $4,370 | $15,263 | $2,550 | $12,713 |
| 2019 | $4,384 | $17,150 | $2,550 | $14,600 |
| 2018 | $4,025 | $14,865 | $2,186 | $12,679 |
| 2017 | $728 | $14,865 | $2,186 | $12,679 |
| 2016 | $1,411 | $14,865 | $2,186 | $12,679 |
| 2015 | $1,623 | $13,141 | $2,003 | $11,138 |
| 2014 | $1,565 | $13,141 | $2,003 | $11,138 |
| 2013 | $1,553 | $13,141 | $2,003 | $11,138 |
Source: Public Records
Map
Nearby Homes
- 12 E Pine St
- 820 S Pine St
- 105 Heritage Ln Unit 173T105
- 11 E Streamwood Blvd
- 111 Cedar Cir
- 110 Cedar Cir
- 107 W Streamwood Blvd
- 122 Brittany Dr Unit 16C2
- 128 Fairview Ln
- 201 W Streamwood Blvd
- 132 Meredith Ln Unit 63
- 110 Elm Ln
- 305 S Bartlett Rd
- 176 Jefferson Ln
- 400 Country Ln
- 158 Jefferson Ln
- 916 Mulberry Ln
- 179 Locksley Dr
- 2074 Essex Ct Unit 2074
- 120 Grow Ln
Your Personal Tour Guide
Ask me questions while you tour the home.