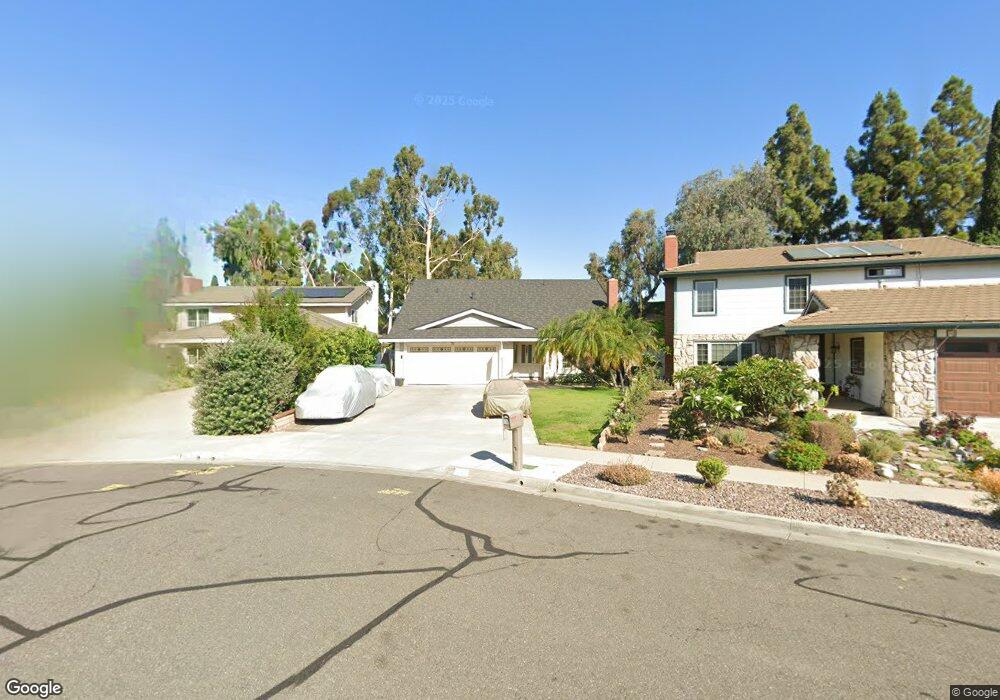
3 Eccelstone Cir Irvine, CA 92604
Walnut NeighborhoodEstimated Value: $1,514,000 - $1,790,000
4
Beds
3
Baths
1,946
Sq Ft
$828/Sq Ft
Est. Value
About This Home
This home is located at 3 Eccelstone Cir, Irvine, CA 92604 and is currently estimated at $1,610,530, approximately $827 per square foot. 3 Eccelstone Cir is a home located in Orange County with nearby schools including Deerfield Elementary School, Venado Middle School, and Irvine High School.
Ownership History
Date
Name
Owned For
Owner Type
Purchase Details
Closed on
Mar 10, 2004
Sold by
Kogawa Akira
Bought by
Kogawa Akira and Kogawa Naoko
Current Estimated Value
Purchase Details
Closed on
Feb 27, 2002
Sold by
Truong Tom Tung and Truong Kim Phung
Bought by
Kogawa Akira
Home Financials for this Owner
Home Financials are based on the most recent Mortgage that was taken out on this home.
Original Mortgage
$445,000
Interest Rate
6.78%
Mortgage Type
Stand Alone First
Purchase Details
Closed on
Sep 9, 1993
Sold by
Nationsbank Of Virginia Na
Bought by
Truong Tom Tung and Truong Kim Phung
Home Financials for this Owner
Home Financials are based on the most recent Mortgage that was taken out on this home.
Original Mortgage
$180,800
Interest Rate
7.25%
Create a Home Valuation Report for This Property
The Home Valuation Report is an in-depth analysis detailing your home's value as well as a comparison with similar homes in the area
Home Values in the Area
Average Home Value in this Area
Purchase History
| Date | Buyer | Sale Price | Title Company |
|---|---|---|---|
| Kogawa Akira | -- | -- | |
| Kogawa Akira | $445,000 | First Southwestern Title Co | |
| Truong Tom Tung | $226,000 | Gateway Title Company |
Source: Public Records
Mortgage History
| Date | Status | Borrower | Loan Amount |
|---|---|---|---|
| Previous Owner | Kogawa Akira | $445,000 | |
| Previous Owner | Truong Tom Tung | $180,800 |
Source: Public Records
Tax History
| Year | Tax Paid | Tax Assessment Tax Assessment Total Assessment is a certain percentage of the fair market value that is determined by local assessors to be the total taxable value of land and additions on the property. | Land | Improvement |
|---|---|---|---|---|
| 2025 | $6,817 | $657,390 | $478,166 | $179,224 |
| 2024 | $6,817 | $644,500 | $468,790 | $175,710 |
| 2023 | $6,640 | $631,863 | $459,598 | $172,265 |
| 2022 | $6,511 | $619,474 | $450,586 | $168,888 |
| 2021 | $6,361 | $607,328 | $441,751 | $165,577 |
| 2020 | $6,324 | $601,101 | $437,221 | $163,880 |
| 2019 | $6,183 | $589,315 | $428,648 | $160,667 |
| 2018 | $6,073 | $577,760 | $420,243 | $157,517 |
| 2017 | $5,946 | $566,432 | $412,003 | $154,429 |
| 2016 | $5,683 | $555,326 | $403,925 | $151,401 |
| 2015 | $5,597 | $546,985 | $397,858 | $149,127 |
| 2014 | $5,488 | $536,271 | $390,065 | $146,206 |
Source: Public Records
Map
Nearby Homes
- 4862 Gainsport Cir
- 7 Timberline
- 12 Silverwood Unit 19
- 5101 Chateau Cir
- 18 Brookdale
- 15231 Touraine Way
- 57 Pinewood Unit 29
- 14592 Highcrest Cir
- 13 Shooting Star
- 95 Wildwood Unit 40
- 15335 Seine Cir
- 32 Goldenbush
- 14851 Jeffrey Rd Unit 69
- 14851 Jeffrey Rd Unit 61
- 14851 Jeffrey Rd Unit 192
- 14851 Jeffrey Rd Unit 241
- 14851 Jeffrey Rd Unit 145
- 14851 Jeffrey Rd Unit 246
- 14851 Jeffrey Rd Unit 7
- 14851 Jeffrey Rd Unit 326
- 5 Eccelstone Cir
- 1 Eccelstone Cir
- 7 Eccelstone Cir
- 4822 Kron
- 9 Eccelstone Cir Unit 3
- 9 Eccelstone Cir Unit 2
- 9 Eccelstone Cir
- 4832 Kron
- 2 Eccelstone Cir
- 15151 Nantes Cir
- 11 Eccelstone Cir
- 4842 Kron
- 4 Eccelstone Cir
- 15152 Nantes Cir
- 6 Eccelstone Cir
- 4852 Kron
- 15161 Nantes Cir
- 16 Sanderling
- 13 Eccelstone Cir
- 14 Sanderling
Your Personal Tour Guide
Ask me questions while you tour the home.