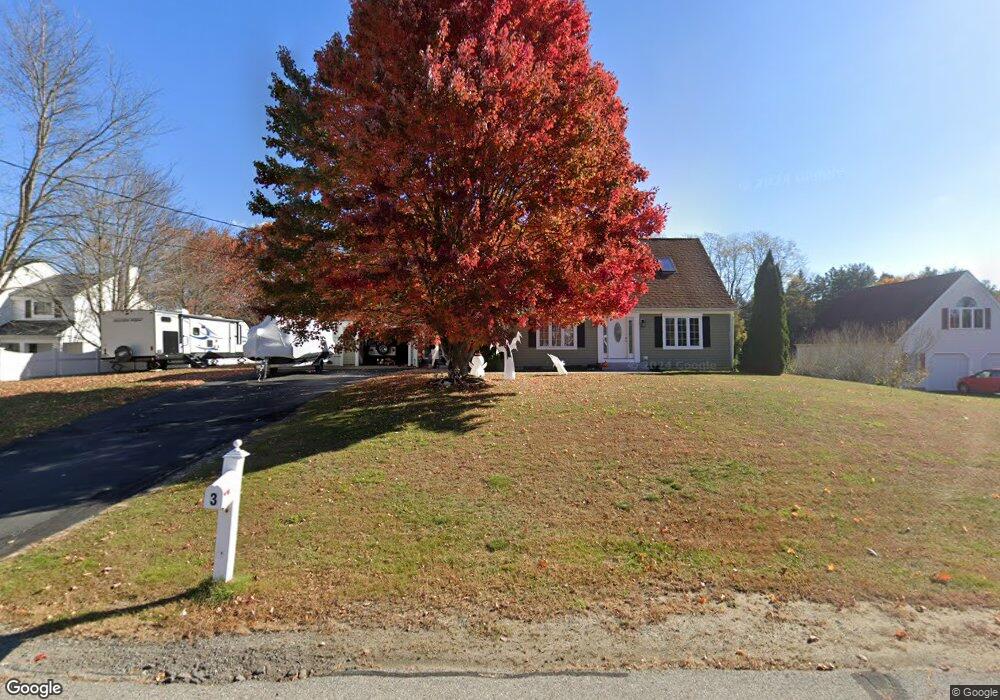
3 Francis Dr Seabrook, NH 03874
Estimated Value: $556,000 - $592,000
3
Beds
2
Baths
1,404
Sq Ft
$413/Sq Ft
Est. Value
About This Home
This home is located at 3 Francis Dr, Seabrook, NH 03874 and is currently estimated at $579,278, approximately $412 per square foot. 3 Francis Dr is a home located in Rockingham County with nearby schools including Seabrook Elementary School, Seabrook Middle School, and Winnacunnet High School.
Ownership History
Date
Name
Owned For
Owner Type
Purchase Details
Closed on
Jan 31, 2012
Sold by
Deutsche Bk Natl T Co
Bought by
Retherford 3Rd Larry and Kennison Stacey
Current Estimated Value
Purchase Details
Closed on
Mar 18, 2011
Sold by
Mcginness Philip R and Deutsche Bk Natl T Co
Bought by
Deutsche Bk Natl T Co
Purchase Details
Closed on
Jun 1, 2001
Sold by
Bailey Eugene R and Bailey Doris A
Bought by
Mcginness Philip R and Mcginness Gina
Home Financials for this Owner
Home Financials are based on the most recent Mortgage that was taken out on this home.
Original Mortgage
$242,250
Interest Rate
7.09%
Mortgage Type
Purchase Money Mortgage
Create a Home Valuation Report for This Property
The Home Valuation Report is an in-depth analysis detailing your home's value as well as a comparison with similar homes in the area
Home Values in the Area
Average Home Value in this Area
Purchase History
| Date | Buyer | Sale Price | Title Company |
|---|---|---|---|
| Retherford 3Rd Larry | $177,200 | -- | |
| Retherford 3Rd Larry | $177,200 | -- | |
| Deutsche Bk Natl T Co | $215,000 | -- | |
| Deutsche Bk Natl T Co | $215,000 | -- | |
| Mcginness Philip R | $255,000 | -- | |
| Mcginness Philip R | $255,000 | -- |
Source: Public Records
Mortgage History
| Date | Status | Borrower | Loan Amount |
|---|---|---|---|
| Open | Mcginness Philip R | $206,500 | |
| Previous Owner | Mcginness Philip R | $242,250 |
Source: Public Records
Tax History Compared to Growth
Tax History
| Year | Tax Paid | Tax Assessment Tax Assessment Total Assessment is a certain percentage of the fair market value that is determined by local assessors to be the total taxable value of land and additions on the property. | Land | Improvement |
|---|---|---|---|---|
| 2024 | $6,142 | $524,100 | $249,600 | $274,500 |
| 2023 | $6,354 | $421,100 | $213,400 | $207,700 |
| 2022 | $5,580 | $421,100 | $213,400 | $207,700 |
| 2021 | $5,504 | $400,900 | $193,200 | $207,700 |
| 2020 | $5,169 | $323,700 | $154,100 | $169,600 |
| 2019 | $5,993 | $320,300 | $154,100 | $166,200 |
| 2018 | $4,989 | $307,000 | $140,800 | $166,200 |
| 2017 | $31 | $289,500 | $123,300 | $166,200 |
| 2016 | $4,282 | $289,500 | $123,300 | $166,200 |
| 2015 | $3,844 | $259,900 | $115,900 | $144,000 |
| 2014 | $3,969 | $259,900 | $115,900 | $144,000 |
| 2013 | $3,969 | $259,900 | $115,900 | $144,000 |
Source: Public Records
Map
Nearby Homes
- 462 New Zealand Rd
- 22 Maple Ridge Rd
- 147 Weare Rd
- 51 Locust St
- 253 Amesbury Rd
- 17 Riley Rd
- 195 Amesbury Rd
- 21 Woodman Rd
- 95 Lillian Ave
- 27 Stacey Ave
- 1 Brown Ave Unit 3-80
- 3 Brown Ave Unit 75
- 57 Clinton St
- 25 Whittier Meadows Dr
- 3 Glenwood St
- 100 Congress St
- 96 Folly Mill Rd
- 63 Drinkwater Rd
- 2 Locke Hill Ln
- 152 Amesbury Rd