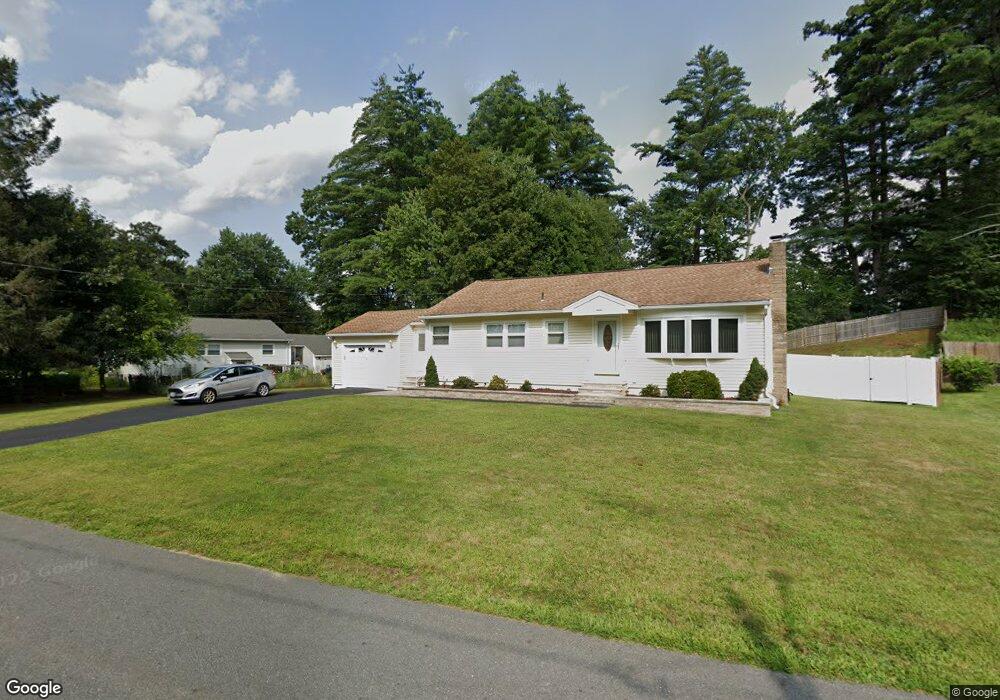
3 Glen Denin Dr Salem, NH 03079
Salem Center NeighborhoodEstimated Value: $529,000 - $574,000
3
Beds
1
Bath
1,176
Sq Ft
$463/Sq Ft
Est. Value
About This Home
This home is located at 3 Glen Denin Dr, Salem, NH 03079 and is currently estimated at $544,122, approximately $462 per square foot. 3 Glen Denin Dr is a home located in Rockingham County with nearby schools including William E. Lancaster School, Woodbury School, and Salem High School.
Ownership History
Date
Name
Owned For
Owner Type
Purchase Details
Closed on
May 9, 2002
Sold by
Wellington Christopher J and Wellington Pamela F
Bought by
Grow Patrick M and Grow Gina L
Current Estimated Value
Home Financials for this Owner
Home Financials are based on the most recent Mortgage that was taken out on this home.
Original Mortgage
$226,345
Interest Rate
7.18%
Mortgage Type
Purchase Money Mortgage
Create a Home Valuation Report for This Property
The Home Valuation Report is an in-depth analysis detailing your home's value as well as a comparison with similar homes in the area
Home Values in the Area
Average Home Value in this Area
Purchase History
| Date | Buyer | Sale Price | Title Company |
|---|---|---|---|
| Grow Patrick M | $229,900 | -- |
Source: Public Records
Mortgage History
| Date | Status | Borrower | Loan Amount |
|---|---|---|---|
| Open | Grow Patrick M | $198,550 | |
| Closed | Grow Patrick M | $226,345 |
Source: Public Records
Tax History Compared to Growth
Tax History
| Year | Tax Paid | Tax Assessment Tax Assessment Total Assessment is a certain percentage of the fair market value that is determined by local assessors to be the total taxable value of land and additions on the property. | Land | Improvement |
|---|---|---|---|---|
| 2024 | $6,797 | $386,200 | $161,300 | $224,900 |
| 2023 | $6,550 | $386,200 | $161,300 | $224,900 |
| 2022 | $6,199 | $386,200 | $161,300 | $224,900 |
| 2021 | $6,171 | $386,200 | $161,300 | $224,900 |
| 2020 | $5,558 | $252,400 | $115,200 | $137,200 |
| 2019 | $5,548 | $252,400 | $115,200 | $137,200 |
| 2018 | $5,454 | $252,400 | $115,200 | $137,200 |
| 2017 | $5,260 | $252,400 | $115,200 | $137,200 |
| 2016 | $5,157 | $252,400 | $115,200 | $137,200 |
| 2015 | $5,016 | $234,500 | $117,900 | $116,600 |
| 2014 | $4,875 | $234,500 | $117,900 | $116,600 |
| 2013 | $4,798 | $234,500 | $117,900 | $116,600 |
Source: Public Records
Map
Nearby Homes
- 27 General Pulaski Dr
- 51 Bluff St
- 55A Millville Cir
- 1 Kimball Ave
- 8 Arcadia Ln
- 3 Roux Ave
- 312 Shore Dr
- 8 Stoneybrook Ln
- 51 Zion Hill Rd
- 30 Scotland Ave
- 22 Nolet Ave
- 4 Therriault Ave
- 1 Ballard Ln
- 6 Douglas Dr
- 8 Alta Ave
- 20 Stanwood Rd
- 40 Stanwood Rd Unit 9
- Massabesic Plan at Atkinson Heights
- Jenness Plan at Atkinson Heights
- Gloucester Plan at Atkinson Heights