Estimated Value: $271,000 - $289,000
4
Beds
2
Baths
1,224
Sq Ft
$228/Sq Ft
Est. Value
About This Home
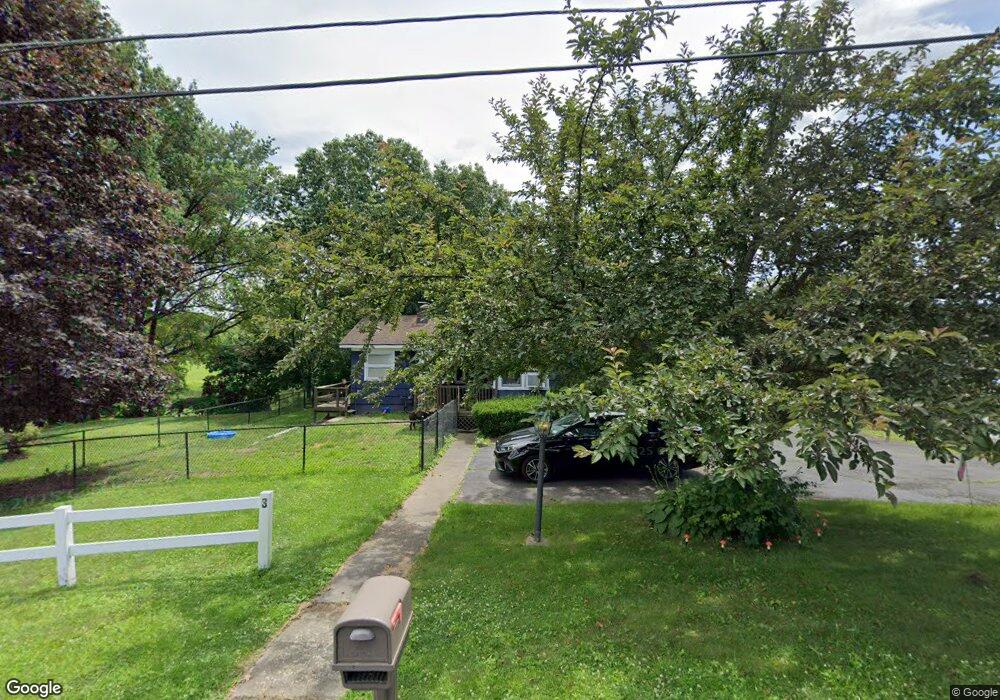
This home is located at 3 Larry Ct, Troy, NY 12182 and is currently estimated at $279,540, approximately $228 per square foot. 3 Larry Ct is a home located in Rensselaer County with nearby schools including Turnpike Elementary School, Rensselaer Park Elementary School, and Knickerbacker Middle School.
Ownership History
Date
Name
Owned For
Owner Type
Purchase Details
Closed on
Jul 15, 2015
Sold by
Harris Johnathan
Bought by
Harris Johnathan
Current Estimated Value
Home Financials for this Owner
Home Financials are based on the most recent Mortgage that was taken out on this home.
Original Mortgage
$143,500
Outstanding Balance
$112,476
Interest Rate
4.01%
Mortgage Type
Purchase Money Mortgage
Estimated Equity
$167,064
Purchase Details
Closed on
Jun 12, 2013
Sold by
Oconnell Family Trust
Bought by
Harris Johnathan P
Home Financials for this Owner
Home Financials are based on the most recent Mortgage that was taken out on this home.
Original Mortgage
$138,838
Interest Rate
3.39%
Mortgage Type
Purchase Money Mortgage
Purchase Details
Closed on
Apr 23, 2012
Sold by
Oconnell Family Trust
Bought by
Oconnell Family Trust Jean
Create a Home Valuation Report for This Property
The Home Valuation Report is an in-depth analysis detailing your home's value as well as a comparison with similar homes in the area
Home Values in the Area
Average Home Value in this Area
Purchase History
| Date | Buyer | Sale Price | Title Company |
|---|---|---|---|
| Harris Johnathan | -- | Alice Breding | |
| Harris Johnathan P | $141,400 | Victor A Caponera Jr | |
| Oconnell Family Trust Jean | -- | Frederick L Fowler |
Source: Public Records
Mortgage History
| Date | Status | Borrower | Loan Amount |
|---|---|---|---|
| Open | Harris Johnathan | $143,500 | |
| Previous Owner | Harris Johnathan P | $138,838 |
Source: Public Records
Tax History
| Year | Tax Paid | Tax Assessment Tax Assessment Total Assessment is a certain percentage of the fair market value that is determined by local assessors to be the total taxable value of land and additions on the property. | Land | Improvement |
|---|---|---|---|---|
| 2024 | $5,120 | $40,300 | $6,400 | $33,900 |
| 2023 | $4,838 | $40,300 | $6,400 | $33,900 |
| 2022 | $4,824 | $40,300 | $6,400 | $33,900 |
| 2021 | $5,270 | $40,300 | $6,400 | $33,900 |
| 2020 | $5,324 | $40,300 | $6,400 | $33,900 |
| 2019 | $5,317 | $40,300 | $6,400 | $33,900 |
| 2018 | $5,317 | $40,300 | $6,400 | $33,900 |
| 2017 | $5,203 | $40,300 | $6,400 | $33,900 |
| 2016 | $5,301 | $40,300 | $6,400 | $33,900 |
| 2015 | -- | $40,300 | $6,400 | $33,900 |
| 2014 | -- | $40,300 | $6,400 | $33,900 |
Source: Public Records
Map
Nearby Homes
Your Personal Tour Guide
Ask me questions while you tour the home.