3 Lower Rd Hudson, MA 01749
Estimated Value: $685,000 - $922,000
4
Beds
3
Baths
1,984
Sq Ft
$382/Sq Ft
Est. Value
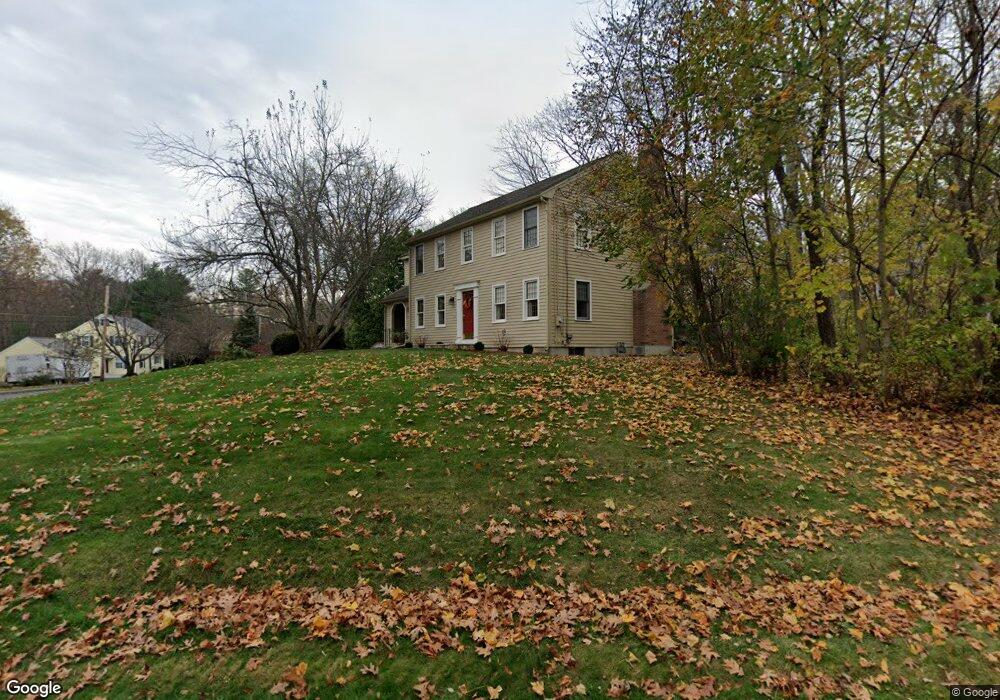
About This Home
This home is located at 3 Lower Rd, Hudson, MA 01749 and is currently estimated at $757,583, approximately $381 per square foot. 3 Lower Rd is a home located in Middlesex County with nearby schools including David J. Quinn Middle School, Hudson High School, and First Steps Children's Center.
Ownership History
Date
Name
Owned For
Owner Type
Purchase Details
Closed on
Dec 10, 2020
Sold by
Keith Pamela J
Bought by
Hogan Edward J and Hogan Carol A
Current Estimated Value
Purchase Details
Closed on
Aug 29, 1997
Sold by
Pierotti Thomas M and Pierotti Lynn M
Bought by
Hogan Edward J and Hogan Carol A
Purchase Details
Closed on
Jul 25, 1994
Sold by
Hall Christopher F and Wallace-Hall Maribeth
Bought by
Pierotti Thomas M and Pierotti Lynn M
Purchase Details
Closed on
Sep 16, 1988
Sold by
Minehan Paul J
Bought by
Hall Christopher F
Create a Home Valuation Report for This Property
The Home Valuation Report is an in-depth analysis detailing your home's value as well as a comparison with similar homes in the area
Home Values in the Area
Average Home Value in this Area
Purchase History
| Date | Buyer | Sale Price | Title Company |
|---|---|---|---|
| Hogan Edward J | -- | None Available | |
| Hogan Edward J | -- | None Available | |
| Keith Pamela J | -- | None Available | |
| Keith Pamela J | -- | None Available | |
| Hogan Edward J | $222,500 | -- | |
| Pierotti Thomas M | $197,500 | -- | |
| Hall Christopher F | $248,000 | -- |
Source: Public Records
Mortgage History
| Date | Status | Borrower | Loan Amount |
|---|---|---|---|
| Previous Owner | Hall Christopher F | $156,500 | |
| Previous Owner | Hall Christopher F | $192,000 |
Source: Public Records
Tax History
| Year | Tax Paid | Tax Assessment Tax Assessment Total Assessment is a certain percentage of the fair market value that is determined by local assessors to be the total taxable value of land and additions on the property. | Land | Improvement |
|---|---|---|---|---|
| 2025 | $8,718 | $628,100 | $192,100 | $436,000 |
| 2024 | $8,935 | $638,200 | $174,500 | $463,700 |
| 2023 | $8,103 | $555,000 | $167,800 | $387,200 |
| 2022 | $7,641 | $481,800 | $152,500 | $329,300 |
| 2021 | $7,260 | $437,600 | $145,300 | $292,300 |
| 2020 | $7,112 | $428,200 | $142,500 | $285,700 |
| 2019 | $6,713 | $394,200 | $142,500 | $251,700 |
| 2018 | $6,683 | $381,900 | $135,700 | $246,200 |
| 2017 | $6,363 | $363,600 | $129,200 | $234,400 |
| 2016 | $5,922 | $342,500 | $129,200 | $213,300 |
| 2015 | $5,682 | $329,000 | $129,200 | $199,800 |
| 2014 | $5,452 | $313,000 | $113,300 | $199,700 |
Source: Public Records
Map
Nearby Homes
- 9 & 9A Abigail
- 7 Old North Rd
- 84 Crosby Rd
- 68 Upland Rd
- 18 Seneca Dr
- 24 Seneca Dr
- 1 Glendale Rd
- 23 Otsego Dr
- 69 Johansen Dr
- 0 Oneida Place
- 20 Beauregard Cir
- 30 Jewell Rd Unit Lot 2
- 48 Jewell Rd Unit Lot 6
- 2 Strawberry Ln Unit C
- 425 Main St Unit 7C
- 425 Main St Unit 21D
- 425 Main St Unit 20D
- 239 Reservoir St
- 0 Stevens St
- 304 Cox St
Your Personal Tour Guide
Ask me questions while you tour the home.