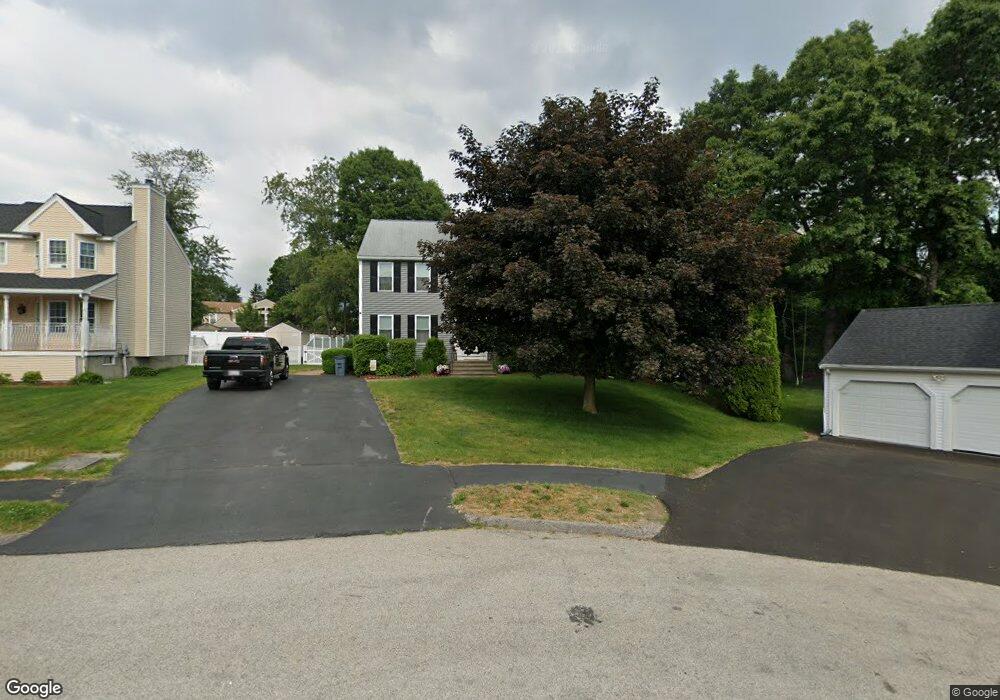
3 Papagni Cir Worcester, MA 01604
Hamilton NeighborhoodEstimated Value: $590,291 - $674,000
4
Beds
3
Baths
2,192
Sq Ft
$279/Sq Ft
Est. Value
About This Home
This home is located at 3 Papagni Cir, Worcester, MA 01604 and is currently estimated at $612,323, approximately $279 per square foot. 3 Papagni Cir is a home located in Worcester County with nearby schools including Jacob Hiatt Magnet School, Chandler Magnet, and Lake View Elementary School.
Ownership History
Date
Name
Owned For
Owner Type
Purchase Details
Closed on
Jan 11, 2022
Sold by
Lonchiadis James and Lonchiadis Lori
Bought by
Lonchiadis Lori and Lonchiadis James
Current Estimated Value
Home Financials for this Owner
Home Financials are based on the most recent Mortgage that was taken out on this home.
Original Mortgage
$509,712
Outstanding Balance
$467,451
Interest Rate
3.05%
Mortgage Type
New Conventional
Estimated Equity
$144,872
Purchase Details
Closed on
Dec 13, 2002
Sold by
Pro Tech Bldrs Inc
Bought by
Lonchiadis James and Chonchio Lori
Home Financials for this Owner
Home Financials are based on the most recent Mortgage that was taken out on this home.
Original Mortgage
$270,750
Interest Rate
6.17%
Mortgage Type
Purchase Money Mortgage
Create a Home Valuation Report for This Property
The Home Valuation Report is an in-depth analysis detailing your home's value as well as a comparison with similar homes in the area
Home Values in the Area
Average Home Value in this Area
Purchase History
| Date | Buyer | Sale Price | Title Company |
|---|---|---|---|
| Lonchiadis Lori | -- | None Available | |
| Lonchiadis Lori | -- | None Available | |
| Lonchiadis James | $285,000 | -- | |
| Lonchiadis James | $285,000 | -- |
Source: Public Records
Mortgage History
| Date | Status | Borrower | Loan Amount |
|---|---|---|---|
| Open | Lonchiadis Lori | $509,712 | |
| Closed | Lonchiadis Lori | $509,712 | |
| Previous Owner | Lonchiadis James | $270,750 |
Source: Public Records
Tax History Compared to Growth
Tax History
| Year | Tax Paid | Tax Assessment Tax Assessment Total Assessment is a certain percentage of the fair market value that is determined by local assessors to be the total taxable value of land and additions on the property. | Land | Improvement |
|---|---|---|---|---|
| 2025 | $6,931 | $525,500 | $118,900 | $406,600 |
| 2024 | $6,696 | $487,000 | $118,900 | $368,100 |
| 2023 | $6,460 | $450,500 | $103,400 | $347,100 |
| 2022 | $5,997 | $394,300 | $82,700 | $311,600 |
| 2021 | $5,989 | $367,900 | $66,200 | $301,700 |
| 2020 | $5,778 | $339,900 | $66,200 | $273,700 |
| 2019 | $5,789 | $321,600 | $59,600 | $262,000 |
| 2018 | $5,724 | $302,700 | $59,600 | $243,100 |
| 2017 | $5,480 | $285,100 | $59,600 | $225,500 |
| 2016 | $5,552 | $269,400 | $44,200 | $225,200 |
| 2015 | $5,407 | $269,400 | $44,200 | $225,200 |
| 2014 | $5,264 | $269,400 | $44,200 | $225,200 |
Source: Public Records
Map
Nearby Homes
- 79 Alvarado Ave
- 47 Alvarado Ave Unit 1A
- 308 Plantation St
- 13 Frank St
- 311 Plantation St
- 24 Sherbrook Ave
- 22 Sherbrook Ave
- 65 Lake Ave Unit 831
- 65 Lake Ave Unit 220
- 65 Lake Ave Unit 1008
- 42 Ancona Rd
- 270 Coburn Ave
- 2 Touraine St
- 241 Lake Ave
- 70 Harrington Way
- 28 Granby Rd
- 10 Imperial Rd
- 4 Harold St
- 360 Hamilton St
- 496 Hamilton St
- 1 Papagni Cir
- 5 Papagni Cir
- 60 Marlboro St
- 821 Franklin St
- 819 Franklin St
- 6 Pollock St
- 8 Pollock St
- 817 Franklin St
- 6 Papagni Cir
- 4 Papagni Cir
- 2 Papagni Cir
- 815 Franklin St
- 1 Christine Dr
- 1 Christine Dr Unit 7
- 16 Pollock St
- 3 Christine Dr
- 2 Christine Dr
- 5 Christine Dr
- 809 Franklin St
- 811 Franklin St