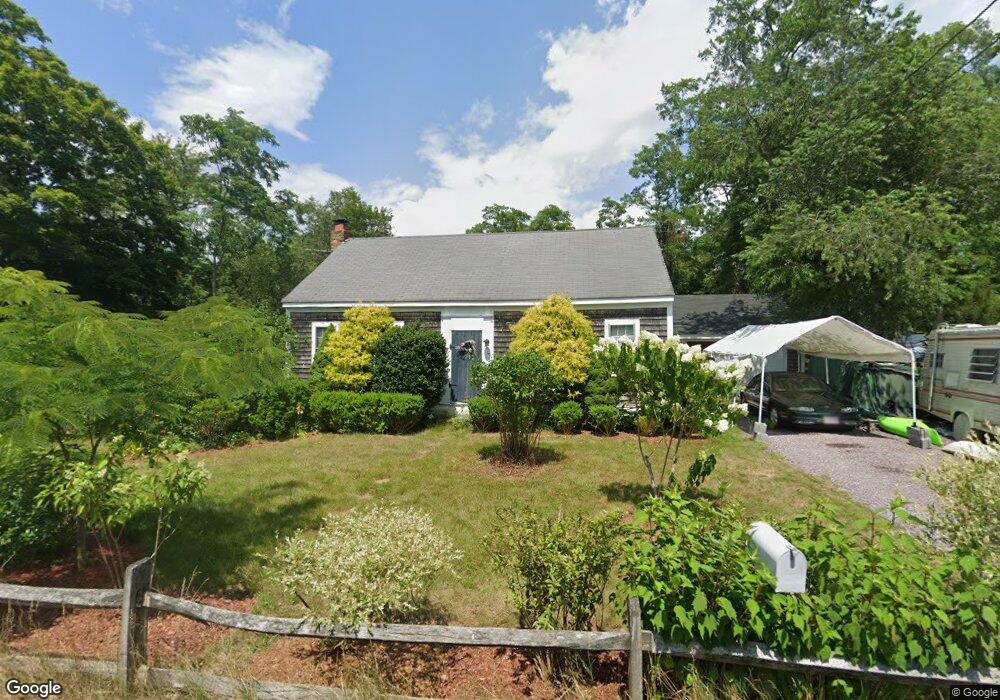
3 Papermill Rd West Wareham, MA 02576
Estimated Value: $395,000 - $437,000
2
Beds
1
Bath
964
Sq Ft
$428/Sq Ft
Est. Value
About This Home
This home is located at 3 Papermill Rd, West Wareham, MA 02576 and is currently estimated at $412,988, approximately $428 per square foot. 3 Papermill Rd is a home located in Plymouth County.
Ownership History
Date
Name
Owned For
Owner Type
Purchase Details
Closed on
Sep 28, 2006
Sold by
Konish Constr Co Inc
Bought by
Ambarik Joseph D
Current Estimated Value
Home Financials for this Owner
Home Financials are based on the most recent Mortgage that was taken out on this home.
Original Mortgage
$171,000
Interest Rate
6.52%
Mortgage Type
Purchase Money Mortgage
Purchase Details
Closed on
Mar 24, 2005
Sold by
I Schroeter Morse Ft and Schroeter Morse Ingrid
Bought by
Konish Constr Co Inc
Create a Home Valuation Report for This Property
The Home Valuation Report is an in-depth analysis detailing your home's value as well as a comparison with similar homes in the area
Home Values in the Area
Average Home Value in this Area
Purchase History
| Date | Buyer | Sale Price | Title Company |
|---|---|---|---|
| Ambarik Joseph D | $190,000 | -- | |
| Ambarik Joseph D | $190,000 | -- | |
| Konish Constr Co Inc | $210,000 | -- | |
| Konish Constr Co Inc | $210,000 | -- |
Source: Public Records
Mortgage History
| Date | Status | Borrower | Loan Amount |
|---|---|---|---|
| Open | Konish Constr Co Inc | $178,100 | |
| Closed | Konish Constr Co Inc | $40,000 | |
| Closed | Konish Constr Co Inc | $171,000 |
Source: Public Records
Tax History
| Year | Tax Paid | Tax Assessment Tax Assessment Total Assessment is a certain percentage of the fair market value that is determined by local assessors to be the total taxable value of land and additions on the property. | Land | Improvement |
|---|---|---|---|---|
| 2025 | $3,384 | $324,800 | $128,600 | $196,200 |
| 2024 | $3,407 | $303,400 | $102,700 | $200,700 |
| 2023 | $3,247 | $269,900 | $93,400 | $176,500 |
| 2022 | $3,064 | $232,500 | $93,400 | $139,100 |
| 2021 | $0 | $225,900 | $93,400 | $132,500 |
| 2020 | $2,908 | $219,300 | $93,400 | $125,900 |
| 2019 | $2,932 | $220,600 | $94,800 | $125,800 |
| 2018 | $0 | $202,300 | $94,800 | $107,500 |
| 2017 | $2,660 | $197,800 | $94,800 | $103,000 |
| 2016 | $2,583 | $190,900 | $94,800 | $96,100 |
| 2015 | $2,495 | $190,900 | $94,800 | $96,100 |
| 2014 | $2,483 | $193,200 | $94,800 | $98,400 |
Source: Public Records
Map
Nearby Homes
Your Personal Tour Guide
Ask me questions while you tour the home.