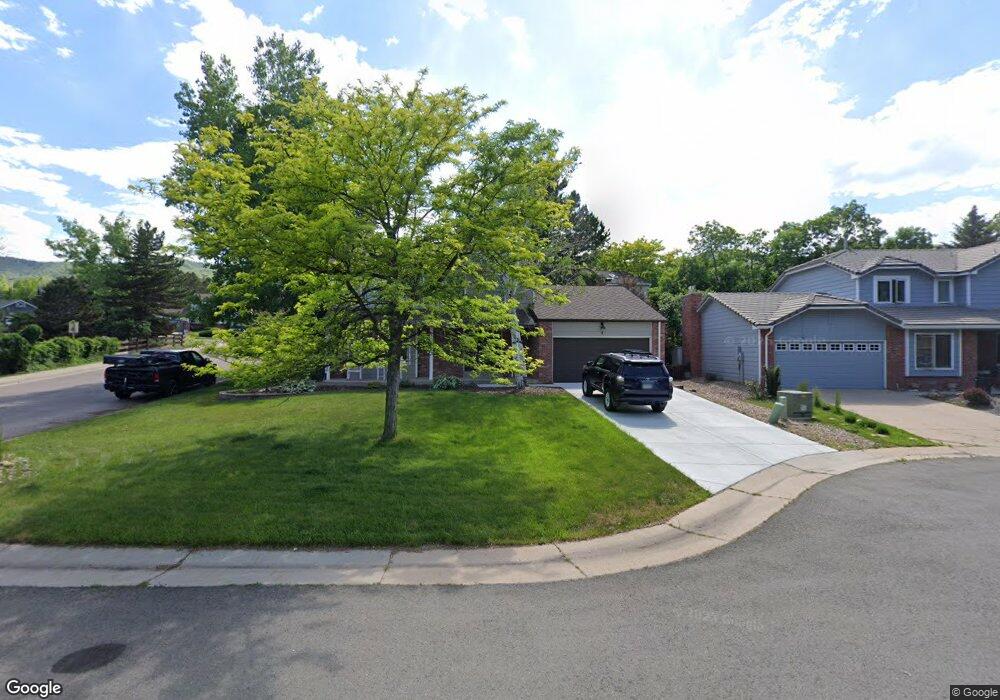
3 Red Locust Littleton, CO 80127
Estimated Value: $955,000 - $1,017,000
6
Beds
4
Baths
2,943
Sq Ft
$331/Sq Ft
Est. Value
About This Home
This home is located at 3 Red Locust, Littleton, CO 80127 and is currently estimated at $974,358, approximately $331 per square foot. 3 Red Locust is a home located in Jefferson County with nearby schools including Bradford K8 South, Bradford K8 North, and Chatfield High School.
Ownership History
Date
Name
Owned For
Owner Type
Purchase Details
Closed on
Apr 21, 2020
Sold by
Fox Daniel Evan and Fox Kelly Lynn
Bought by
Chacon Raul and Chacon Leah
Current Estimated Value
Home Financials for this Owner
Home Financials are based on the most recent Mortgage that was taken out on this home.
Original Mortgage
$453,900
Outstanding Balance
$401,337
Interest Rate
3.3%
Mortgage Type
New Conventional
Estimated Equity
$573,021
Purchase Details
Closed on
Oct 26, 2015
Sold by
Fox Daniel Evan
Bought by
Fox Daniel Evan and Fox Kelly Lynn Ward
Home Financials for this Owner
Home Financials are based on the most recent Mortgage that was taken out on this home.
Original Mortgage
$320,100
Interest Rate
3.9%
Mortgage Type
New Conventional
Purchase Details
Closed on
Jan 24, 2014
Sold by
Spark Properties Group Llc
Bought by
Fox Daniel Evan
Home Financials for this Owner
Home Financials are based on the most recent Mortgage that was taken out on this home.
Original Mortgage
$321,077
Interest Rate
4.25%
Mortgage Type
FHA
Purchase Details
Closed on
Oct 7, 2013
Sold by
Zwolinski Julie M
Bought by
Spark Properties Group Llc
Purchase Details
Closed on
Mar 24, 2009
Sold by
Zwolinski Frank M
Bought by
Zwolinski Julie M
Purchase Details
Closed on
May 27, 2005
Sold by
Rukstales Kenneth Scott and Rukstales Lisa
Bought by
Zwolinski Frank M and Zwolinski Julie M
Home Financials for this Owner
Home Financials are based on the most recent Mortgage that was taken out on this home.
Original Mortgage
$256,480
Interest Rate
7.99%
Mortgage Type
Fannie Mae Freddie Mac
Purchase Details
Closed on
Nov 25, 2002
Sold by
Lacy Charles J and Lacy Sandra L
Bought by
Rukstales Kenneth Scott and Rukstales Lisa
Home Financials for this Owner
Home Financials are based on the most recent Mortgage that was taken out on this home.
Original Mortgage
$244,000
Interest Rate
6.28%
Create a Home Valuation Report for This Property
The Home Valuation Report is an in-depth analysis detailing your home's value as well as a comparison with similar homes in the area
Home Values in the Area
Average Home Value in this Area
Purchase History
| Date | Buyer | Sale Price | Title Company |
|---|---|---|---|
| Chacon Raul | $643,900 | None Available | |
| Fox Daniel Evan | -- | First Integrity Title | |
| Fox Daniel Evan | $327,000 | None Available | |
| Spark Properties Group Llc | $26,510 | None Available | |
| Zwolinski Julie M | -- | None Available | |
| Zwolinski Frank M | $320,600 | Chicago Title Co | |
| Rukstales Kenneth Scott | $305,000 | Guardian Title |
Source: Public Records
Mortgage History
| Date | Status | Borrower | Loan Amount |
|---|---|---|---|
| Open | Chacon Raul | $453,900 | |
| Previous Owner | Fox Daniel Evan | $320,100 | |
| Previous Owner | Fox Daniel Evan | $321,077 | |
| Previous Owner | Zwolinski Frank M | $256,480 | |
| Previous Owner | Rukstales Kenneth Scott | $244,000 | |
| Closed | Zwolinski Frank M | $64,120 |
Source: Public Records
Tax History Compared to Growth
Tax History
| Year | Tax Paid | Tax Assessment Tax Assessment Total Assessment is a certain percentage of the fair market value that is determined by local assessors to be the total taxable value of land and additions on the property. | Land | Improvement |
|---|---|---|---|---|
| 2024 | $5,812 | $54,289 | $12,912 | $41,377 |
| 2023 | $5,812 | $54,289 | $12,912 | $41,377 |
| 2022 | $5,015 | $45,810 | $12,147 | $33,663 |
| 2021 | $5,092 | $47,128 | $12,497 | $34,631 |
| 2020 | $4,161 | $38,643 | $10,697 | $27,946 |
| 2019 | $4,112 | $38,643 | $10,697 | $27,946 |
| 2018 | $3,880 | $35,216 | $9,585 | $25,631 |
| 2017 | $3,608 | $35,216 | $9,585 | $25,631 |
| 2016 | $3,779 | $34,900 | $11,163 | $23,737 |
| 2015 | $3,351 | $34,900 | $11,163 | $23,737 |
| 2014 | $3,351 | $29,161 | $8,545 | $20,616 |
Source: Public Records
Map
Nearby Homes
- 16 Honey Locust
- 1 Cliffrose
- 25 Summit Ash
- 10 Oakmont Ln
- 39 Buckthorn Dr
- 8 Oakmont Ln
- 5 Tamarade Dr
- 4 Oakmont Ln
- 1 Amaranth Dr
- 85 Willowleaf Dr
- 87 Deerwood Dr
- 12 Long Spur
- 2 Silvermound
- 18 Blue Sage
- 6 Amberwood Ln
- 7367 S Yank Ct
- 7346 S Yank Ct
- 7316 S Yank Ct
- 12750 W Glasgow Place
- 12740 W Glasgow Place