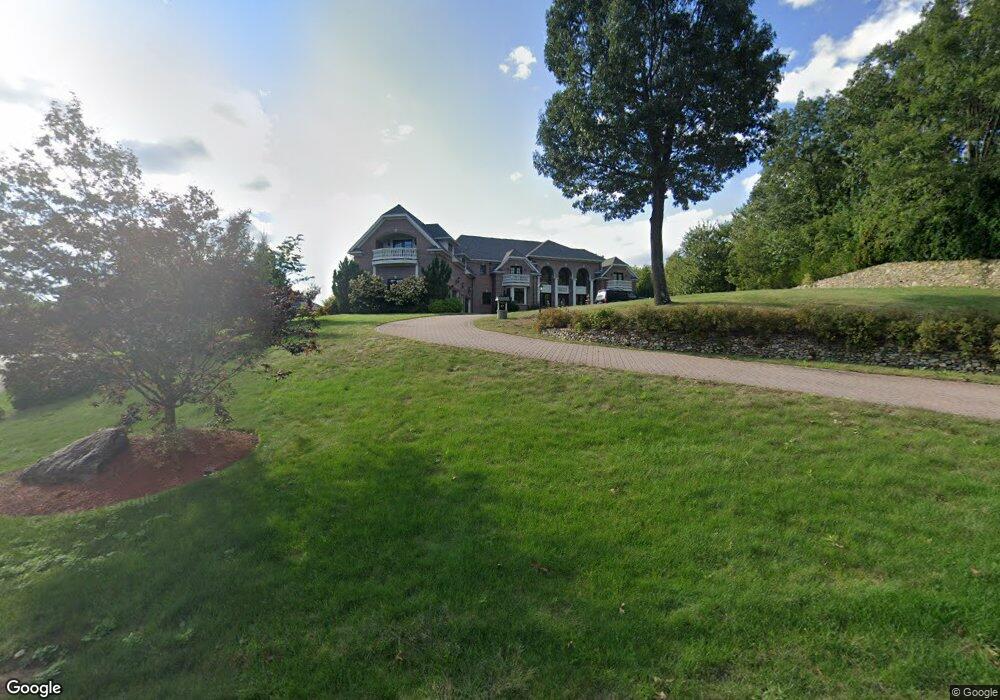
3 Regency Ridge Andover, MA 01810
Estimated Value: $2,872,000 - $5,369,000
8
Beds
10
Baths
19,311
Sq Ft
$224/Sq Ft
Est. Value
About This Home
This home is located at 3 Regency Ridge, Andover, MA 01810 and is currently estimated at $4,323,329, approximately $223 per square foot. 3 Regency Ridge is a home located in Essex County with nearby schools including South Elementary School, Doherty Middle School, and Andover High School.
Ownership History
Date
Name
Owned For
Owner Type
Purchase Details
Closed on
Oct 17, 2011
Sold by
Labusa Inc
Bought by
Afreeddi Mohammed F
Current Estimated Value
Purchase Details
Closed on
Feb 12, 2010
Sold by
Shama Rt
Bought by
Labusa Inc
Home Financials for this Owner
Home Financials are based on the most recent Mortgage that was taken out on this home.
Original Mortgage
$1,800,000
Interest Rate
5.12%
Purchase Details
Closed on
May 18, 2009
Sold by
Leung-Chau Kevin Hin and Mun-Yuen Glorianna Wai
Bought by
Afreedi Mohammad F and Afreedi Shama F
Purchase Details
Closed on
Mar 1, 2000
Sold by
Rosecliff Rt and Zaloga David V
Bought by
Chau Kevin Leung Chau and Yuen Glorianna Wai Mun
Create a Home Valuation Report for This Property
The Home Valuation Report is an in-depth analysis detailing your home's value as well as a comparison with similar homes in the area
Home Values in the Area
Average Home Value in this Area
Purchase History
| Date | Buyer | Sale Price | Title Company |
|---|---|---|---|
| Afreeddi Mohammed F | -- | -- | |
| Labusa Inc | -- | -- | |
| Afreedi Mohammad F | $1,000,000 | -- | |
| Chau Kevin Leung Chau | $455,000 | -- |
Source: Public Records
Mortgage History
| Date | Status | Borrower | Loan Amount |
|---|---|---|---|
| Previous Owner | Labusa Inc | $1,800,000 |
Source: Public Records
Tax History Compared to Growth
Tax History
| Year | Tax Paid | Tax Assessment Tax Assessment Total Assessment is a certain percentage of the fair market value that is determined by local assessors to be the total taxable value of land and additions on the property. | Land | Improvement |
|---|---|---|---|---|
| 2024 | $65,348 | $5,073,600 | $1,444,500 | $3,629,100 |
| 2023 | $61,566 | $4,507,000 | $1,235,100 | $3,271,900 |
| 2022 | $58,807 | $4,027,900 | $1,113,100 | $2,914,800 |
| 2021 | $56,425 | $3,690,300 | $1,012,100 | $2,678,200 |
| 2020 | $54,617 | $3,638,700 | $1,012,100 | $2,626,600 |
| 2019 | $54,341 | $3,558,700 | $982,700 | $2,576,000 |
| 2018 | $51,984 | $3,323,800 | $954,200 | $2,369,600 |
| 2017 | $49,957 | $3,291,000 | $935,500 | $2,355,500 |
| 2016 | $48,915 | $3,300,600 | $935,500 | $2,365,100 |
| 2015 | $47,413 | $3,167,200 | $935,500 | $2,231,700 |
Source: Public Records
Map
Nearby Homes
- 5 Regency Ridge
- 1 Regency Ridge
- 99 Sunset Rock Rd
- 105 Sunset Rock Rd
- 4 Regency Ridge
- Lot 4 Regency Place
- 9 Regency Ridge
- 6 Regency Ridge
- 1 Aston Ct
- 1 Countryside Way
- 6 Regency Ridge
- 7 Regency Ridge
- 95 Sunset Rock Rd
- 102 Sunset Rock Rd
- 8 Regency Ridge
- 3 Countryside Way
- 29 Alderbrook Rd
- 2 Shandel Cir
- 15 Regency Ridge
- 10 Regency Ridge