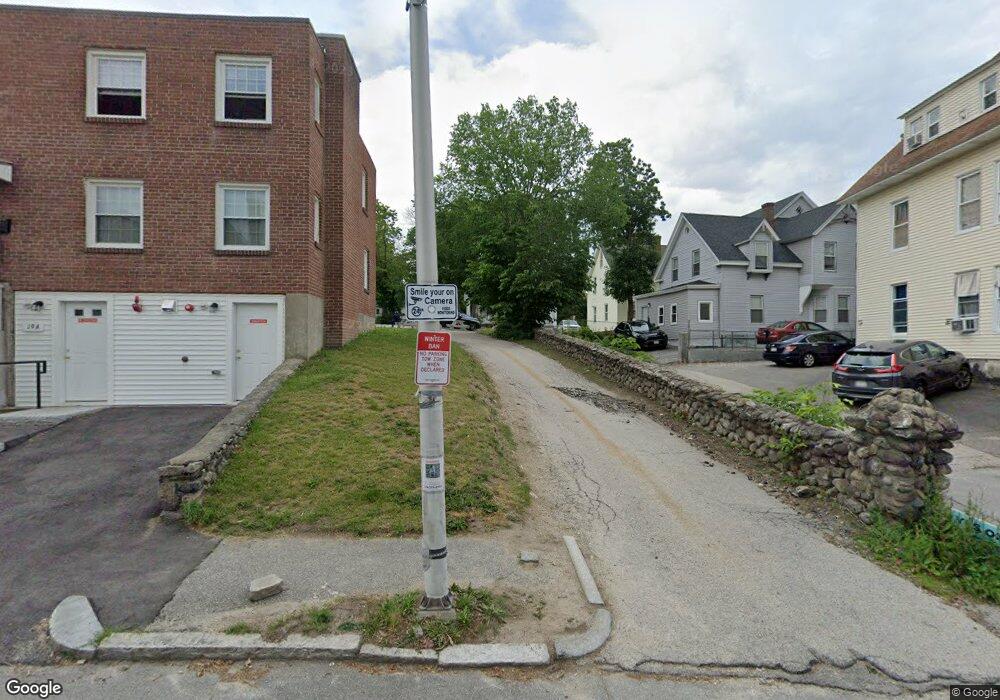
3 Ripley Place Worcester, MA 01610
Beacon Brightly NeighborhoodEstimated Value: $349,850 - $560,000
3
Beds
2
Baths
1,404
Sq Ft
$301/Sq Ft
Est. Value
About This Home
This home is located at 3 Ripley Place, Worcester, MA 01610 and is currently estimated at $421,963, approximately $300 per square foot. 3 Ripley Place is a home located in Worcester County with nearby schools including Jacob Hiatt Magnet School, Chandler Magnet, and Woodland Academy.
Ownership History
Date
Name
Owned For
Owner Type
Purchase Details
Closed on
Sep 29, 2004
Sold by
Pham Cuong C
Bought by
Tran Son
Current Estimated Value
Home Financials for this Owner
Home Financials are based on the most recent Mortgage that was taken out on this home.
Original Mortgage
$140,000
Outstanding Balance
$69,521
Interest Rate
5.81%
Mortgage Type
Purchase Money Mortgage
Estimated Equity
$352,442
Purchase Details
Closed on
Jul 10, 2002
Sold by
Pham Kiep
Bought by
Pham Cuong C
Home Financials for this Owner
Home Financials are based on the most recent Mortgage that was taken out on this home.
Original Mortgage
$76,000
Interest Rate
6.79%
Mortgage Type
Purchase Money Mortgage
Purchase Details
Closed on
Jan 14, 2000
Sold by
Daigneault Armand R and Daigneault Ann M
Bought by
Pham Hiep
Create a Home Valuation Report for This Property
The Home Valuation Report is an in-depth analysis detailing your home's value as well as a comparison with similar homes in the area
Home Values in the Area
Average Home Value in this Area
Purchase History
| Date | Buyer | Sale Price | Title Company |
|---|---|---|---|
| Tran Son | $175,000 | -- | |
| Pham Cuong C | $95,000 | -- | |
| Pham Hiep | $35,000 | -- |
Source: Public Records
Mortgage History
| Date | Status | Borrower | Loan Amount |
|---|---|---|---|
| Open | Tran Son | $140,000 | |
| Previous Owner | Pham Hiep | $76,000 |
Source: Public Records
Tax History Compared to Growth
Tax History
| Year | Tax Paid | Tax Assessment Tax Assessment Total Assessment is a certain percentage of the fair market value that is determined by local assessors to be the total taxable value of land and additions on the property. | Land | Improvement |
|---|---|---|---|---|
| 2025 | $3,483 | $264,100 | $65,200 | $198,900 |
| 2024 | $3,341 | $243,000 | $65,200 | $177,800 |
| 2023 | $3,056 | $213,100 | $52,400 | $160,700 |
| 2022 | $2,943 | $193,500 | $41,900 | $151,600 |
| 2021 | $2,554 | $156,900 | $33,500 | $123,400 |
| 2020 | $2,394 | $140,800 | $33,600 | $107,200 |
| 2019 | $2,522 | $140,100 | $33,200 | $106,900 |
| 2018 | $2,468 | $130,500 | $33,200 | $97,300 |
| 2017 | $2,337 | $121,600 | $33,200 | $88,400 |
| 2016 | $2,339 | $113,500 | $27,100 | $86,400 |
| 2015 | $2,278 | $113,500 | $27,100 | $86,400 |
| 2014 | $2,218 | $113,500 | $27,100 | $86,400 |
Source: Public Records
Map
Nearby Homes