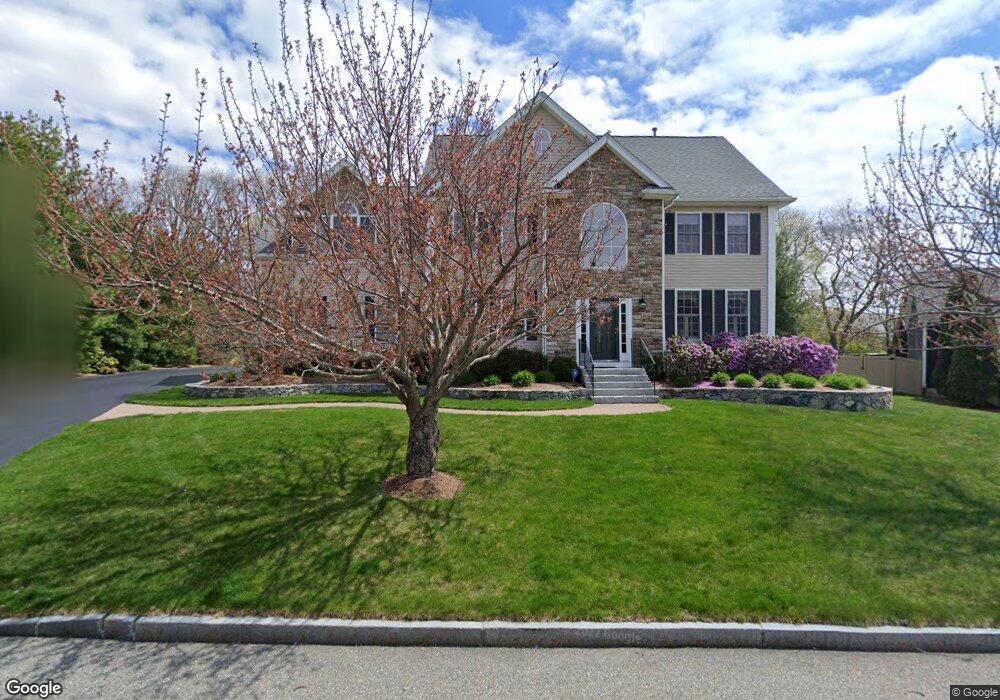
3 Rons Way Framingham, MA 01701
Nobscot NeighborhoodEstimated Value: $1,044,000 - $1,138,000
4
Beds
3
Baths
3,200
Sq Ft
$342/Sq Ft
Est. Value
About This Home
This home is located at 3 Rons Way, Framingham, MA 01701 and is currently estimated at $1,093,984, approximately $341 per square foot. 3 Rons Way is a home located in Middlesex County with nearby schools including Framingham High School, MetroWest Jewish Day School, and Sudbury Valley School.
Ownership History
Date
Name
Owned For
Owner Type
Purchase Details
Closed on
Mar 23, 2021
Sold by
Byank Brian G and Byank Karen M
Bought by
Brian G Byank T G and Brian Byank
Current Estimated Value
Purchase Details
Closed on
Sep 28, 2007
Sold by
Rosewood Capital Corp
Bought by
Byank Brian G and Byank Karen M
Home Financials for this Owner
Home Financials are based on the most recent Mortgage that was taken out on this home.
Original Mortgage
$550,000
Interest Rate
6.65%
Mortgage Type
Purchase Money Mortgage
Purchase Details
Closed on
Feb 8, 2007
Sold by
3 Rons Way Llc and Rosewood Capital Corp
Bought by
Rosewood Capital Corp
Create a Home Valuation Report for This Property
The Home Valuation Report is an in-depth analysis detailing your home's value as well as a comparison with similar homes in the area
Home Values in the Area
Average Home Value in this Area
Purchase History
| Date | Buyer | Sale Price | Title Company |
|---|---|---|---|
| Brian G Byank T G | -- | None Available | |
| Brian G Byank T G | -- | None Available | |
| Byank Brian G | $730,000 | -- | |
| Byank Brian G | $730,000 | -- | |
| Rosewood Capital Corp | $450,000 | -- | |
| Rosewood Capital Corp | $450,000 | -- |
Source: Public Records
Mortgage History
| Date | Status | Borrower | Loan Amount |
|---|---|---|---|
| Previous Owner | Rosewood Capital Corp | $497,000 | |
| Previous Owner | Rosewood Capital Corp | $523,750 | |
| Previous Owner | Byank Brian G | $550,000 |
Source: Public Records
Tax History Compared to Growth
Tax History
| Year | Tax Paid | Tax Assessment Tax Assessment Total Assessment is a certain percentage of the fair market value that is determined by local assessors to be the total taxable value of land and additions on the property. | Land | Improvement |
|---|---|---|---|---|
| 2025 | $12,581 | $1,053,700 | $271,200 | $782,500 |
| 2024 | $11,820 | $948,600 | $242,200 | $706,400 |
| 2023 | $11,378 | $869,200 | $216,200 | $653,000 |
| 2022 | $10,965 | $798,000 | $196,200 | $601,800 |
| 2021 | $10,616 | $755,600 | $188,600 | $567,000 |
| 2020 | $11,236 | $750,100 | $171,400 | $578,700 |
| 2019 | $11,169 | $726,200 | $171,400 | $554,800 |
| 2018 | $11,067 | $678,100 | $165,000 | $513,100 |
| 2017 | $11,029 | $660,000 | $160,200 | $499,800 |
| 2016 | $10,977 | $631,600 | $160,200 | $471,400 |
| 2015 | $10,460 | $587,000 | $160,700 | $426,300 |
Source: Public Records
Map
Nearby Homes
- 82 Joseph Rd
- 14 Francine Rd
- 53 Davidson Rd
- 1 Brookvale Rd
- 15 Fairbrook Rd
- 30 Edith Rd
- 163 Water St
- 19 Park Ave
- 27 Sloane Dr
- 217 Central St
- 8 Clara Rd
- 40 Gregory Rd
- 24 Pinewood Dr
- 81 Nicholas Rd Unit B
- 71 Nicholas Rd Unit H
- 18 Lomas Dr
- 78 Apple d or Rd
- 915 Edgell Rd Unit 85
- 41 James St
- 14 Eisenhower Rd