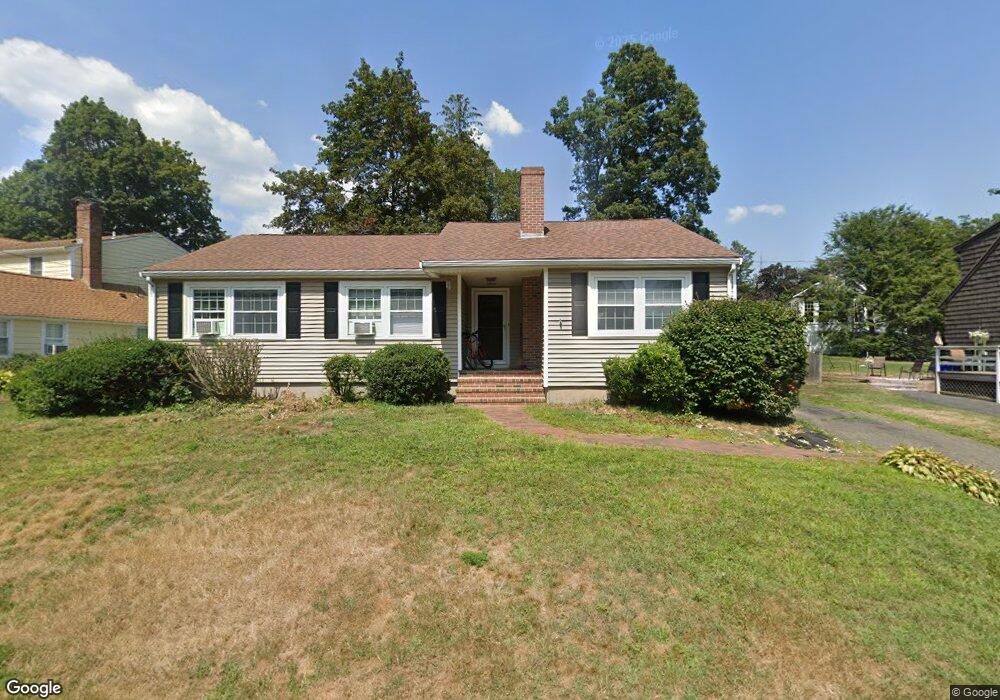
3 Stanton St Wenham, MA 01984
Estimated Value: $801,444 - $988,000
3
Beds
2
Baths
2,025
Sq Ft
$454/Sq Ft
Est. Value
About This Home
This home is located at 3 Stanton St, Wenham, MA 01984 and is currently estimated at $920,111, approximately $454 per square foot. 3 Stanton St is a home located in Essex County with nearby schools including Winthrop School, Cutler Elementary School, and Miles River Middle School.
Ownership History
Date
Name
Owned For
Owner Type
Purchase Details
Closed on
Sep 29, 2011
Sold by
Penniman James N and Penniman Amy L
Bought by
Adler Martin B and Alder Sharon L
Current Estimated Value
Home Financials for this Owner
Home Financials are based on the most recent Mortgage that was taken out on this home.
Original Mortgage
$336,000
Interest Rate
4.15%
Mortgage Type
Purchase Money Mortgage
Purchase Details
Closed on
Jul 5, 2007
Sold by
Shaw David E and Shaw Susan
Bought by
Penniman James N
Purchase Details
Closed on
Jun 20, 1997
Sold by
Devlin Andrew D and Shea-Devlin Lydia
Bought by
Shaw David E and Shaw Susan
Purchase Details
Closed on
Sep 30, 1991
Sold by
Stilphen Eric L and Stilphen Janet
Bought by
Devlin Andrew D and Devlin Lydia Shea
Create a Home Valuation Report for This Property
The Home Valuation Report is an in-depth analysis detailing your home's value as well as a comparison with similar homes in the area
Home Values in the Area
Average Home Value in this Area
Purchase History
| Date | Buyer | Sale Price | Title Company |
|---|---|---|---|
| Adler Martin B | $420,000 | -- | |
| Adler Martin B | $420,000 | -- | |
| Penniman James N | $390,000 | -- | |
| Penniman James N | $390,000 | -- | |
| Shaw David E | $211,000 | -- | |
| Shaw David E | $211,000 | -- | |
| Devlin Andrew D | $163,000 | -- | |
| Devlin Andrew D | $163,000 | -- |
Source: Public Records
Mortgage History
| Date | Status | Borrower | Loan Amount |
|---|---|---|---|
| Open | Devlin Andrew D | $335,000 | |
| Closed | Devlin Andrew D | $336,000 |
Source: Public Records
Tax History Compared to Growth
Tax History
| Year | Tax Paid | Tax Assessment Tax Assessment Total Assessment is a certain percentage of the fair market value that is determined by local assessors to be the total taxable value of land and additions on the property. | Land | Improvement |
|---|---|---|---|---|
| 2025 | $10,287 | $662,000 | $412,000 | $250,000 |
| 2024 | $10,102 | $645,100 | $412,000 | $233,100 |
| 2023 | $11,531 | $664,600 | $427,700 | $236,900 |
| 2022 | $9,688 | $494,800 | $330,100 | $164,700 |
| 2021 | $9,256 | $470,300 | $305,600 | $164,700 |
| 2020 | $8,733 | $461,100 | $300,700 | $160,400 |
| 2019 | $8,309 | $461,100 | $300,700 | $160,400 |
| 2018 | $7,619 | $405,500 | $291,000 | $114,500 |
| 2017 | $7,433 | $405,500 | $291,000 | $114,500 |
| 2016 | $6,885 | $405,500 | $291,000 | $114,500 |
| 2015 | $6,589 | $405,500 | $291,000 | $114,500 |
Source: Public Records
Map
Nearby Homes