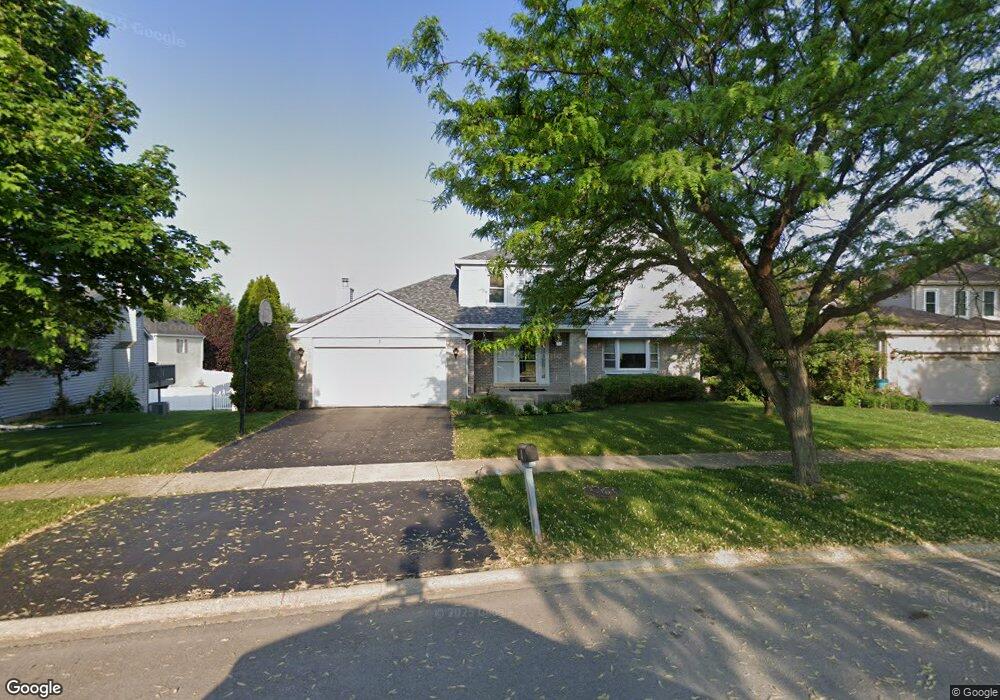
3 Tangly Ct Bolingbrook, IL 60440
West 83rd NeighborhoodEstimated Value: $427,000 - $464,000
Studio
1
Bath
2,222
Sq Ft
$200/Sq Ft
Est. Value
About This Home
This home is located at 3 Tangly Ct, Bolingbrook, IL 60440 and is currently estimated at $444,791, approximately $200 per square foot. 3 Tangly Ct is a home located in DuPage County with nearby schools including John L. Sipley Elementary School, Thomas Jefferson Junior High School, and Downers Grove South High School.
Ownership History
Date
Name
Owned For
Owner Type
Purchase Details
Closed on
May 8, 2013
Sold by
Mathew Vattamparampil C and Mathew Kunjunjamma
Bought by
Mathew Vattamparampil C and Mathew Kunjunjamma
Current Estimated Value
Home Financials for this Owner
Home Financials are based on the most recent Mortgage that was taken out on this home.
Original Mortgage
$165,400
Outstanding Balance
$35,579
Interest Rate
3.25%
Mortgage Type
New Conventional
Estimated Equity
$409,212
Purchase Details
Closed on
Jul 26, 1995
Sold by
Harris Bank Naperville
Bought by
Mathew Vattampar and Mathew Kunjunjamma
Home Financials for this Owner
Home Financials are based on the most recent Mortgage that was taken out on this home.
Original Mortgage
$160,000
Interest Rate
7.56%
Create a Home Valuation Report for This Property
The Home Valuation Report is an in-depth analysis detailing your home's value as well as a comparison with similar homes in the area
Home Values in the Area
Average Home Value in this Area
Purchase History
| Date | Buyer | Sale Price | Title Company |
|---|---|---|---|
| Mathew Vattamparampil C | -- | Change Of Title Inc | |
| Mathew Vattampar | $181,000 | -- |
Source: Public Records
Mortgage History
| Date | Status | Borrower | Loan Amount |
|---|---|---|---|
| Open | Mathew Vattamparampil C | $165,400 | |
| Closed | Mathew Vattampar | $160,000 |
Source: Public Records
Tax History
| Year | Tax Paid | Tax Assessment Tax Assessment Total Assessment is a certain percentage of the fair market value that is determined by local assessors to be the total taxable value of land and additions on the property. | Land | Improvement |
|---|---|---|---|---|
| 2024 | $6,078 | $138,541 | $49,756 | $88,785 |
| 2023 | $6,400 | $126,440 | $45,410 | $81,030 |
| 2022 | $6,873 | $114,940 | $41,280 | $73,660 |
| 2021 | $6,843 | $110,590 | $39,720 | $70,870 |
| 2020 | $6,844 | $108,610 | $39,010 | $69,600 |
| 2019 | $7,008 | $103,910 | $37,320 | $66,590 |
| 2018 | $7,212 | $100,760 | $36,190 | $64,570 |
| 2017 | $7,264 | $97,360 | $34,970 | $62,390 |
| 2016 | $7,491 | $93,840 | $33,710 | $60,130 |
| 2015 | $7,883 | $90,200 | $32,400 | $57,800 |
| 2014 | $8,005 | $90,200 | $32,400 | $57,800 |
| 2013 | $7,852 | $90,420 | $32,480 | $57,940 |
Source: Public Records
Map
Nearby Homes
- 1070 N Ashbury Ave
- 1018 Rain Tree Dr
- 8305 Route 53 Unit A10
- 2713 Northcreek Dr Unit 5
- 2710 Northcreek Dr Unit 1804
- 8320 Oak Leaf Dr Unit 1302
- 3012 Scenicwood Ln
- 836 Bonnie Brae Ln
- 632 Sheffield Ln
- 6305 Sandbelt Dr Unit 33003
- 3599 Kennedy Ln Unit 14001
- 704 N Pinecrest Rd
- 775 Feather Sound Dr
- 2505 Spring St Unit 3304
- 7624 Westview Ln
- 7652 Catalpa Ave
- 7 Purchase Ct
- 231 Charlotte Ln
- 140 Pamela Dr
- 598 Miner Dr
- 5 Tangly Ct
- 1 Tangly Ct
- 328 Twin Creeks Ct
- 2 Tangly Ct
- 322 Twin Creeks Ct
- 7 Tangly Ct
- 334 Twin Creeks Ct
- 4 Tangly Ct
- 352 Stone Creek Dr
- 6 Tangly Ct
- 370 Stone Creek Dr
- 340 Twin Creeks Ct
- 9 Tangly Ct
- 8 Tangly Ct
- 3 Bent Tree Ct
- 351 Stone Creek Dr
- 363 Stone Creek Dr
- 11 Tangly Ct
- 303 Twin Creeks Ct
- 5 Bent Tree Ct
Your Personal Tour Guide
Ask me questions while you tour the home.