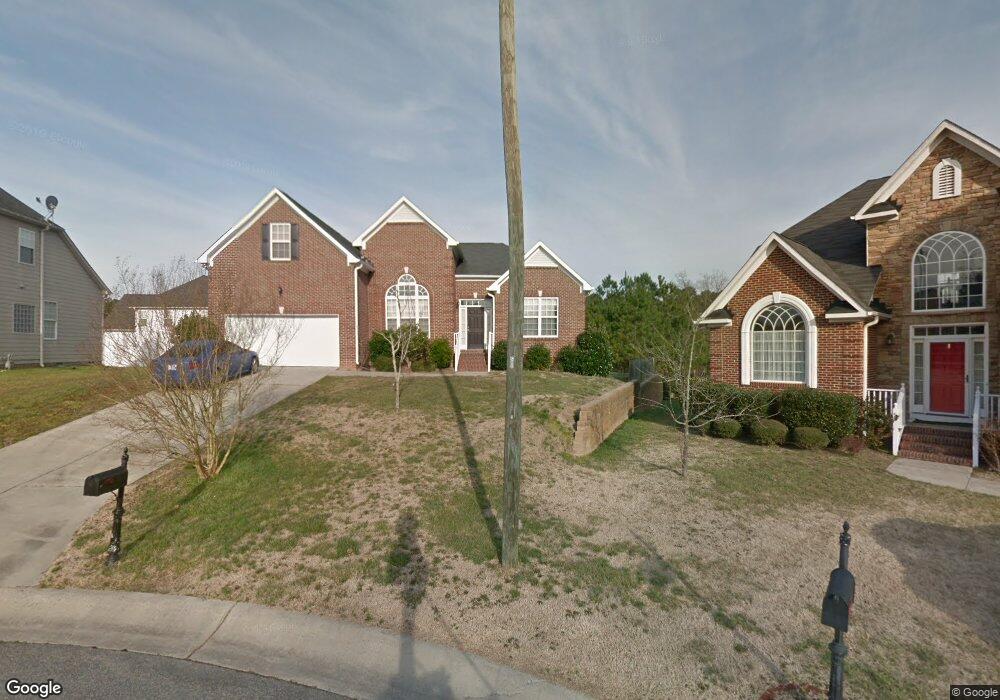
3 Thorn Brook Ct Durham, NC 27703
Eastern Durham NeighborhoodEstimated Value: $456,710 - $486,000
3
Beds
2
Baths
2,390
Sq Ft
$198/Sq Ft
Est. Value
About This Home
This home is located at 3 Thorn Brook Ct, Durham, NC 27703 and is currently estimated at $472,428, approximately $197 per square foot. 3 Thorn Brook Ct is a home located in Durham County with nearby schools including Oak Grove Elementary, John W Neal Middle School, and Southern School of Energy & Sustainability.
Ownership History
Date
Name
Owned For
Owner Type
Purchase Details
Closed on
Jun 21, 2007
Sold by
Sirva Relocation Credit Llc
Bought by
Gagum Marilyn A
Current Estimated Value
Home Financials for this Owner
Home Financials are based on the most recent Mortgage that was taken out on this home.
Original Mortgage
$246,500
Outstanding Balance
$149,274
Interest Rate
6%
Mortgage Type
Purchase Money Mortgage
Estimated Equity
$323,154
Purchase Details
Closed on
Jan 23, 2007
Sold by
Oelrichs Kyle F
Bought by
Sirva Relocation Credit Llc
Purchase Details
Closed on
Apr 20, 2006
Sold by
Karamanian Andre A
Bought by
Oelrichs Kyle F
Home Financials for this Owner
Home Financials are based on the most recent Mortgage that was taken out on this home.
Original Mortgage
$197,200
Interest Rate
6.29%
Mortgage Type
Fannie Mae Freddie Mac
Purchase Details
Closed on
Sep 21, 2004
Sold by
D R Horton Inc Torrey
Bought by
Williams Sharon Lee
Create a Home Valuation Report for This Property
The Home Valuation Report is an in-depth analysis detailing your home's value as well as a comparison with similar homes in the area
Home Values in the Area
Average Home Value in this Area
Purchase History
| Date | Buyer | Sale Price | Title Company |
|---|---|---|---|
| Gagum Marilyn A | $246,500 | Stewart National Title Svcs | |
| Sirva Relocation Credit Llc | $246,500 | Stewart National Title Svcs | |
| Oelrichs Kyle F | $246,500 | None Available | |
| Williams Sharon Lee | $269,000 | -- |
Source: Public Records
Mortgage History
| Date | Status | Borrower | Loan Amount |
|---|---|---|---|
| Open | Gagum Marilyn A | $246,500 | |
| Previous Owner | Oelrichs Kyle F | $197,200 |
Source: Public Records
Tax History Compared to Growth
Tax History
| Year | Tax Paid | Tax Assessment Tax Assessment Total Assessment is a certain percentage of the fair market value that is determined by local assessors to be the total taxable value of land and additions on the property. | Land | Improvement |
|---|---|---|---|---|
| 2025 | $4,686 | $472,695 | $92,250 | $380,445 |
| 2024 | $3,953 | $283,420 | $45,937 | $237,483 |
| 2023 | $3,713 | $283,420 | $45,937 | $237,483 |
| 2022 | $3,627 | $283,420 | $45,937 | $237,483 |
| 2021 | $3,610 | $283,420 | $45,937 | $237,483 |
| 2020 | $3,525 | $283,420 | $45,937 | $237,483 |
| 2019 | $3,525 | $283,420 | $45,937 | $237,483 |
| 2018 | $3,240 | $238,817 | $42,875 | $195,942 |
| 2017 | $3,216 | $238,817 | $42,875 | $195,942 |
| 2016 | $3,107 | $238,817 | $42,875 | $195,942 |
| 2015 | $3,312 | $239,230 | $52,785 | $186,445 |
| 2014 | $3,312 | $239,230 | $52,785 | $186,445 |
Source: Public Records
Map
Nearby Homes
- 1 Thorn Brook Ct
- 103 Bermuda Green Dr
- 106 Newberry Ln
- 406 Robbins Rd
- 402 Robbins Rd
- 110 Kindlewood Dr
- 2800-2809 Napoli Dr
- 4 Fire Rock Place
- 208 Lick Creek Ln
- 10 Autrey Mill Cir
- 210 Stallings Rd
- 2117 Fletchers Ridge Dr
- 5609 Thistlerock Ln
- 1 Kings Grant Ct
- 5409 Hadrian Dr
- 301 Sylvias Ct
- 4 N Berrymeadow Ln
- 31 S Angela Cir
- 416 Chivalry Dr
- 1318 Cosmic Dr
- 5 Thorn Brook Ct
- 913 Oak Grove Pkwy
- 911 Oak Grove Pkwy
- 6 Thorn Brook Ct
- 2 Thorn Brook Ct
- 909 Oak Grove Pkwy
- 2 Piedmont Forest Ct
- 4 Thorn Brook Ct
- 912 Oak Grove Pkwy
- 4 Piedmont Forest Ct
- 907 Oak Grove Pkwy
- 1 Piedmont Forest Ct
- 6 Piedmont Forest Ct
- 910 Oak Grove Pkwy
- 3 Piedmont Forest Ct
- 905 Oak Grove Pkwy
- 5 Piedmont Forest Ct
- 908 Oak Grove Pkwy
- 5 Piedmont Forest Ct
- 8 Piedmont Forest Ct