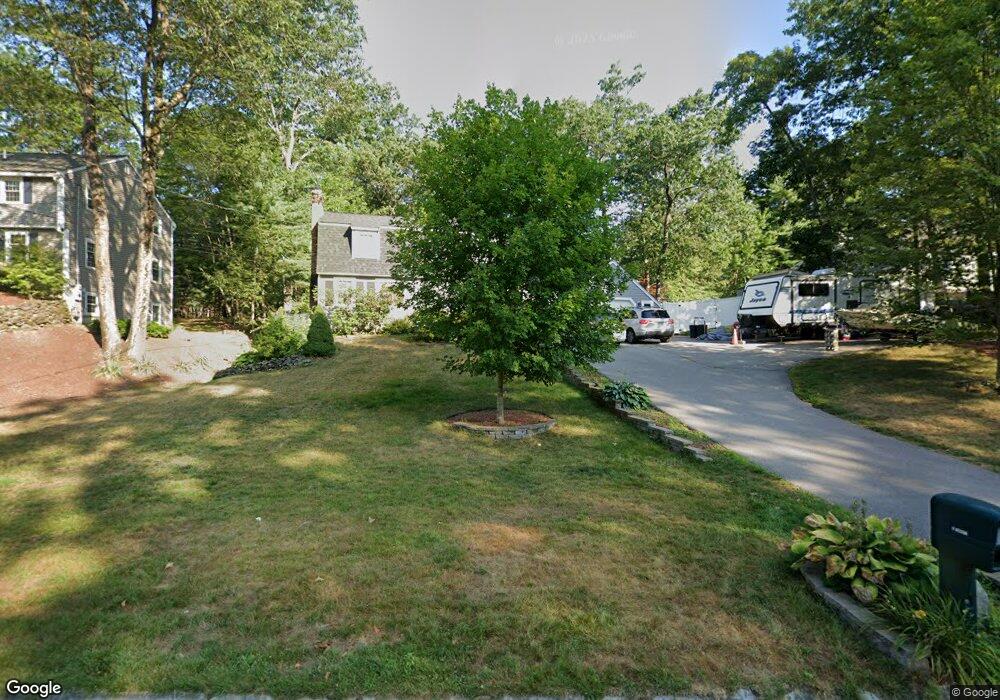
3 Torrey Rd Nashua, NH 03063
Northwest Nashua NeighborhoodEstimated Value: $565,000 - $731,000
4
Beds
2
Baths
1,694
Sq Ft
$366/Sq Ft
Est. Value
About This Home
This home is located at 3 Torrey Rd, Nashua, NH 03063 and is currently estimated at $620,256, approximately $366 per square foot. 3 Torrey Rd is a home located in Hillsborough County with nearby schools including Birch Hill Elementary School, Elm Street Middle School, and Nashua High School North.
Ownership History
Date
Name
Owned For
Owner Type
Purchase Details
Closed on
May 5, 2010
Sold by
Ganguly Suvankar
Bought by
Delaney Kevin M
Current Estimated Value
Home Financials for this Owner
Home Financials are based on the most recent Mortgage that was taken out on this home.
Original Mortgage
$212,087
Interest Rate
5.03%
Mortgage Type
Purchase Money Mortgage
Purchase Details
Closed on
Sep 6, 2002
Sold by
Virgulak Sharon A
Bought by
Ganguly Suvankar
Home Financials for this Owner
Home Financials are based on the most recent Mortgage that was taken out on this home.
Original Mortgage
$251,750
Interest Rate
6.39%
Purchase Details
Closed on
May 25, 1999
Sold by
Tinius Konrad S
Bought by
Virgulak Sharon A
Create a Home Valuation Report for This Property
The Home Valuation Report is an in-depth analysis detailing your home's value as well as a comparison with similar homes in the area
Home Values in the Area
Average Home Value in this Area
Purchase History
| Date | Buyer | Sale Price | Title Company |
|---|---|---|---|
| Delaney Kevin M | $216,000 | -- | |
| Ganguly Suvankar | $265,000 | -- | |
| Virgulak Sharon A | $159,900 | -- |
Source: Public Records
Mortgage History
| Date | Status | Borrower | Loan Amount |
|---|---|---|---|
| Open | Virgulak Sharon A | $205,000 | |
| Closed | Virgulak Sharon A | $212,087 | |
| Previous Owner | Virgulak Sharon A | $27,509 | |
| Previous Owner | Virgulak Sharon A | $251,750 |
Source: Public Records
Tax History Compared to Growth
Tax History
| Year | Tax Paid | Tax Assessment Tax Assessment Total Assessment is a certain percentage of the fair market value that is determined by local assessors to be the total taxable value of land and additions on the property. | Land | Improvement |
|---|---|---|---|---|
| 2024 | $8,107 | $509,900 | $179,700 | $330,200 |
| 2023 | $7,872 | $431,800 | $143,700 | $288,100 |
| 2022 | $7,803 | $431,800 | $143,700 | $288,100 |
| 2021 | $7,217 | $310,800 | $105,400 | $205,400 |
| 2020 | $7,027 | $310,800 | $105,400 | $205,400 |
| 2019 | $6,763 | $310,800 | $105,400 | $205,400 |
| 2018 | $6,592 | $310,800 | $105,400 | $205,400 |
| 2017 | $6,110 | $236,900 | $86,600 | $150,300 |
| 2016 | $5,939 | $236,900 | $86,600 | $150,300 |
| 2015 | $5,811 | $236,900 | $86,600 | $150,300 |
| 2014 | $5,707 | $237,300 | $87,000 | $150,300 |
Source: Public Records
Map
Nearby Homes
- 4 Jared Cir Unit U21
- 5 Chatfield Dr Unit U18
- 239 Broad St
- 7 Robert Dr
- 19 Dunloggin Rd
- 36 Hampton Dr
- 424 Broad St
- 14 Parrish Hill Dr
- 6 Cornwall Ln Unit 7
- 74 Profile Cir
- 22 Cathedral Cir
- 11 Inca Dr
- 5 Meghan Dr Unit U23
- 3 Wright Rd
- 58 Profile Cir
- 123 Cannongate III
- 22 Berkshire Rd
- 3 Richmond St
- 4 Nelson St
- 27 Country Hill Rd Unit U90