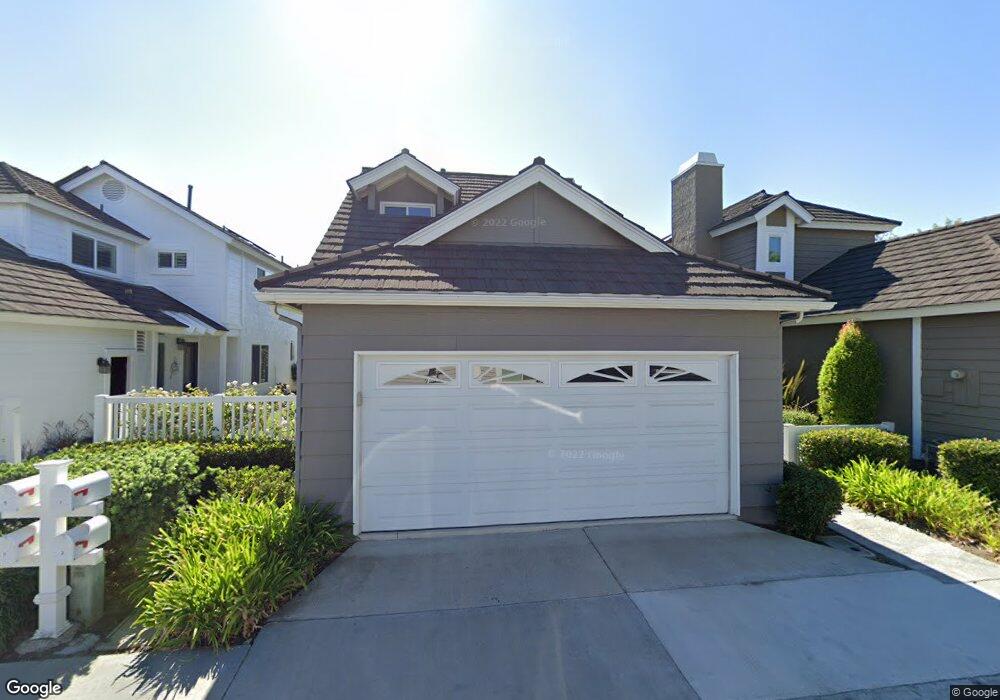
3 Trawler Laguna Niguel, CA 92677
Beacon Hill NeighborhoodEstimated Value: $1,313,660 - $1,685,000
2
Beds
3
Baths
1,508
Sq Ft
$994/Sq Ft
Est. Value
About This Home
This home is located at 3 Trawler, Laguna Niguel, CA 92677 and is currently estimated at $1,498,915, approximately $993 per square foot. 3 Trawler is a home located in Orange County with nearby schools including John Malcom Elementary School, Niguel Hills Middle School, and Dana Hills High School.
Ownership History
Date
Name
Owned For
Owner Type
Purchase Details
Closed on
Aug 20, 2010
Sold by
Sechrist Sterling A
Bought by
Sechrist Sterling Anders and The Sterling Anders Sechrist 2009 Trust
Current Estimated Value
Home Financials for this Owner
Home Financials are based on the most recent Mortgage that was taken out on this home.
Original Mortgage
$308,900
Interest Rate
4.38%
Mortgage Type
New Conventional
Purchase Details
Closed on
Oct 6, 1999
Sold by
Allen Morris
Bought by
Sechrist Sterling A
Home Financials for this Owner
Home Financials are based on the most recent Mortgage that was taken out on this home.
Original Mortgage
$240,000
Interest Rate
7.68%
Purchase Details
Closed on
Oct 20, 1993
Sold by
Morris Allen L and Gosche Esther
Bought by
Morris Allen L
Home Financials for this Owner
Home Financials are based on the most recent Mortgage that was taken out on this home.
Original Mortgage
$162,400
Interest Rate
7.16%
Create a Home Valuation Report for This Property
The Home Valuation Report is an in-depth analysis detailing your home's value as well as a comparison with similar homes in the area
Home Values in the Area
Average Home Value in this Area
Purchase History
| Date | Buyer | Sale Price | Title Company |
|---|---|---|---|
| Sechrist Sterling Anders | -- | Lawyers Title | |
| Sechrist Sterling A | $319,000 | Orange Coast Title | |
| Morris Allen L | -- | First American Title Company |
Source: Public Records
Mortgage History
| Date | Status | Borrower | Loan Amount |
|---|---|---|---|
| Closed | Sechrist Sterling Anders | $308,900 | |
| Closed | Sechrist Sterling A | $240,000 | |
| Previous Owner | Morris Allen L | $162,400 | |
| Closed | Sechrist Sterling A | $34,000 |
Source: Public Records
Tax History Compared to Growth
Tax History
| Year | Tax Paid | Tax Assessment Tax Assessment Total Assessment is a certain percentage of the fair market value that is determined by local assessors to be the total taxable value of land and additions on the property. | Land | Improvement |
|---|---|---|---|---|
| 2025 | $4,812 | $490,286 | $294,288 | $195,998 |
| 2024 | $4,812 | $480,673 | $288,518 | $192,155 |
| 2023 | $4,709 | $471,249 | $282,861 | $188,388 |
| 2022 | $4,618 | $462,009 | $277,314 | $184,695 |
| 2021 | $4,527 | $452,950 | $271,876 | $181,074 |
| 2020 | $4,482 | $448,306 | $269,088 | $179,218 |
| 2019 | $4,473 | $439,516 | $263,812 | $175,704 |
| 2018 | $4,478 | $430,899 | $258,640 | $172,259 |
| 2017 | $4,352 | $422,450 | $253,568 | $168,882 |
| 2016 | $4,372 | $414,167 | $248,596 | $165,571 |
| 2015 | $4,229 | $407,946 | $244,862 | $163,084 |
| 2014 | $4,163 | $399,955 | $240,065 | $159,890 |
Source: Public Records
Map
Nearby Homes
- 2 High Bluff
- 11 High Bluff
- 21 Campton Place
- 31 White Sail
- 24 Costa Brava
- 1 Pacifico
- 226 Shorebreaker Dr
- 22 Terrace Cir
- 37 Terrace Cir
- 94 Shorebreaker Dr
- 5 Ebony Glade
- 32391 Barkentine Blvd
- 9 Pembroke Ln
- 23966 Wanigan Way
- 1 Moss Landing
- 32395 Outrigger Way Unit 22
- 24 Bright Water Dr
- 16 Corniche Dr Unit A
- 55 S Peak
- 46 Terra Vista