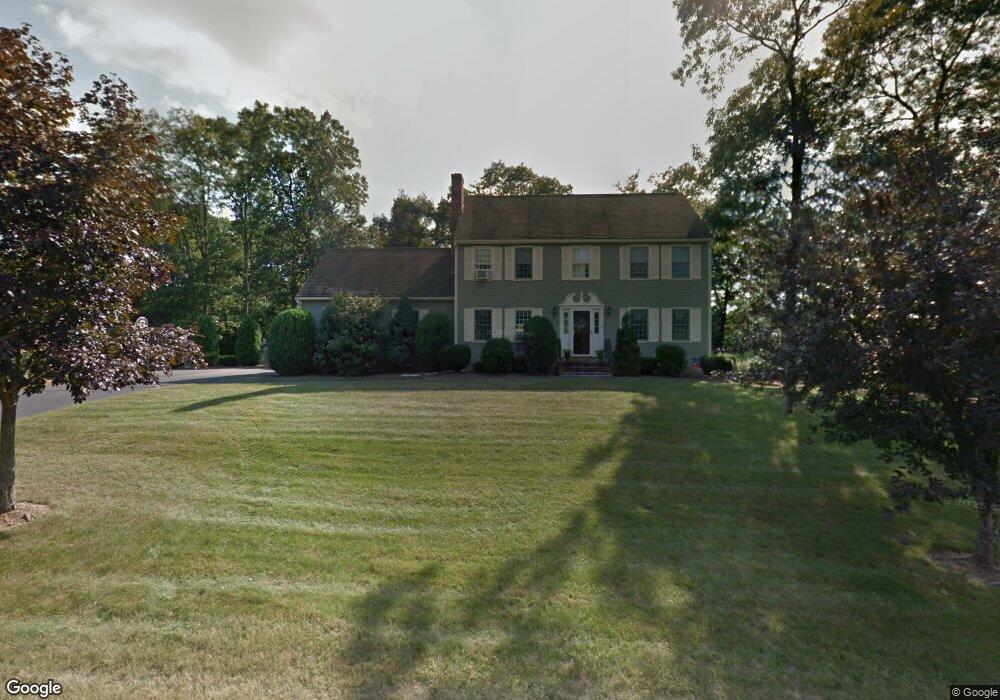
3 Tyler Dr Franklin, MA 02038
Estimated Value: $897,434 - $971,000
4
Beds
3
Baths
2,600
Sq Ft
$359/Sq Ft
Est. Value
About This Home
This home is located at 3 Tyler Dr, Franklin, MA 02038 and is currently estimated at $932,359, approximately $358 per square foot. 3 Tyler Dr is a home located in Norfolk County with nearby schools including Oak Street Elementary School, Horace Mann Middle School, and Franklin High School.
Ownership History
Date
Name
Owned For
Owner Type
Purchase Details
Closed on
Apr 30, 2007
Sold by
Collins John P and Collins Martha S
Bought by
Oconnor Brian and Oconnor Kerrin A
Current Estimated Value
Home Financials for this Owner
Home Financials are based on the most recent Mortgage that was taken out on this home.
Original Mortgage
$404,000
Outstanding Balance
$245,875
Interest Rate
6.18%
Mortgage Type
Purchase Money Mortgage
Estimated Equity
$686,484
Purchase Details
Closed on
May 30, 1997
Sold by
Maple Crest Dev Corp
Bought by
Collins John P and Collins Martha S
Home Financials for this Owner
Home Financials are based on the most recent Mortgage that was taken out on this home.
Original Mortgage
$140,000
Interest Rate
8.09%
Mortgage Type
Purchase Money Mortgage
Create a Home Valuation Report for This Property
The Home Valuation Report is an in-depth analysis detailing your home's value as well as a comparison with similar homes in the area
Home Values in the Area
Average Home Value in this Area
Purchase History
| Date | Buyer | Sale Price | Title Company |
|---|---|---|---|
| Oconnor Brian | $505,000 | -- | |
| Collins John P | $229,900 | -- |
Source: Public Records
Mortgage History
| Date | Status | Borrower | Loan Amount |
|---|---|---|---|
| Open | Oconnor Brian | $404,000 | |
| Previous Owner | Collins John P | $139,950 | |
| Previous Owner | Collins John P | $140,000 |
Source: Public Records
Tax History Compared to Growth
Tax History
| Year | Tax Paid | Tax Assessment Tax Assessment Total Assessment is a certain percentage of the fair market value that is determined by local assessors to be the total taxable value of land and additions on the property. | Land | Improvement |
|---|---|---|---|---|
| 2025 | $8,520 | $733,200 | $359,900 | $373,300 |
| 2024 | $8,719 | $739,500 | $359,900 | $379,600 |
| 2023 | $8,309 | $660,500 | $343,900 | $316,600 |
| 2022 | $7,948 | $565,700 | $266,600 | $299,100 |
| 2021 | $7,829 | $534,400 | $257,300 | $277,100 |
| 2020 | $7,597 | $523,600 | $259,900 | $263,700 |
| 2019 | $7,368 | $502,600 | $239,100 | $263,500 |
| 2018 | $7,161 | $488,800 | $252,100 | $236,700 |
| 2017 | $7,240 | $496,600 | $259,900 | $236,700 |
| 2016 | $6,864 | $473,400 | $239,300 | $234,100 |
| 2015 | $6,685 | $450,500 | $216,400 | $234,100 |
| 2014 | $6,390 | $442,200 | $208,100 | $234,100 |
Source: Public Records
Map
Nearby Homes
- 41 Kimberlee Ave
- 336 Maple St
- 2 Kayla Dr
- 208 Irondequoit Rd
- 60 Southgate Rd
- 2 Noanet Brook Ln
- 204 Lincoln St
- 159 Highwood Dr
- 66 Highwood Dr
- 83 Highwood Dr Unit 83
- 31 Highwood Dr
- 2211 Franklin Crossing Rd Unit 2211
- 1805 Franklin Crossing Rd
- 17 Longhill Rd
- 48 Pinehurst St
- 605 Franklin Crossing Rd
- 57 Raymond St Unit 2
- 14 Pleasant St Unit A
- 150 Pleasant St
- 70 Daniels St