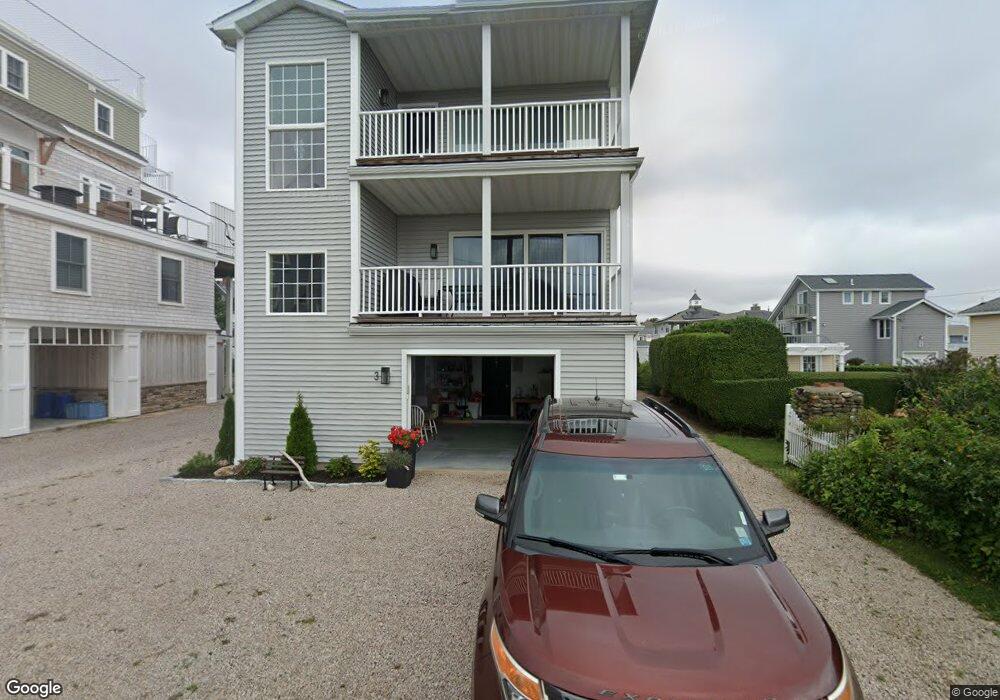
3 Violet Ln Westerly, RI 02891
Estimated Value: $1,016,000 - $1,485,000
2
Beds
3
Baths
1,886
Sq Ft
$643/Sq Ft
Est. Value
About This Home
This home is located at 3 Violet Ln, Westerly, RI 02891 and is currently estimated at $1,212,498, approximately $642 per square foot. 3 Violet Ln is a home located in Washington County with nearby schools including Westerly High School.
Ownership History
Date
Name
Owned For
Owner Type
Purchase Details
Closed on
May 12, 2009
Sold by
Sorensen & Mccuin Con Ll
Bought by
Licitra Joseph A and Licitra Jan M
Current Estimated Value
Home Financials for this Owner
Home Financials are based on the most recent Mortgage that was taken out on this home.
Original Mortgage
$417,000
Interest Rate
4.9%
Mortgage Type
Purchase Money Mortgage
Create a Home Valuation Report for This Property
The Home Valuation Report is an in-depth analysis detailing your home's value as well as a comparison with similar homes in the area
Home Values in the Area
Average Home Value in this Area
Purchase History
| Date | Buyer | Sale Price | Title Company |
|---|---|---|---|
| Licitra Joseph A | $472,000 | -- |
Source: Public Records
Mortgage History
| Date | Status | Borrower | Loan Amount |
|---|---|---|---|
| Open | Licitra Joseph A | $400,000 | |
| Closed | Licitra Joseph A | $417,000 | |
| Previous Owner | Licitra Joseph A | $470,000 |
Source: Public Records
Tax History
| Year | Tax Paid | Tax Assessment Tax Assessment Total Assessment is a certain percentage of the fair market value that is determined by local assessors to be the total taxable value of land and additions on the property. | Land | Improvement |
|---|---|---|---|---|
| 2025 | $7,927 | $1,114,900 | $811,800 | $303,100 |
| 2024 | $8,083 | $824,000 | $579,900 | $244,100 |
| 2023 | $7,927 | $824,000 | $579,900 | $244,100 |
| 2022 | $7,877 | $824,000 | $579,900 | $244,100 |
| 2021 | $6,836 | $593,400 | $394,000 | $199,400 |
| 2020 | $6,711 | $593,400 | $394,000 | $199,400 |
| 2019 | $6,646 | $593,400 | $394,000 | $199,400 |
| 2018 | $6,451 | $543,000 | $373,800 | $169,200 |
| 2017 | $6,293 | $543,000 | $373,800 | $169,200 |
| 2016 | $6,342 | $543,000 | $373,800 | $169,200 |
| 2015 | $5,907 | $545,900 | $381,400 | $164,500 |
| 2014 | $5,808 | $545,900 | $381,400 | $164,500 |
Source: Public Records
Map
Nearby Homes
- 27 Benson Ave
- 10 Tristam St
- 9 Compass Way Unit 201
- 9 Compass Way Unit 202
- 9 Compass Way Unit 101
- 9 Compass Way Unit 102
- 9 Compass Way Unit 103
- 9 Compass Way Unit 203
- 4 Shore Rd
- 109 Watch Hill Rd
- 4 Quail Run
- 20 Browning Rd
- 52 Avondale Rd
- 60 Avondale Rd
- 9 Champlin Dr
- 417 River Rd
- 432 Atlantic Ave
- 446 Atlantic Ave
- 18 Timothy Dr
- 19 Wicklow Rd
Your Personal Tour Guide
Ask me questions while you tour the home.