3 Walbridge Ct Algonquin, IL 60102
Far West Algonquin NeighborhoodEstimated Value: $459,000 - $609,000
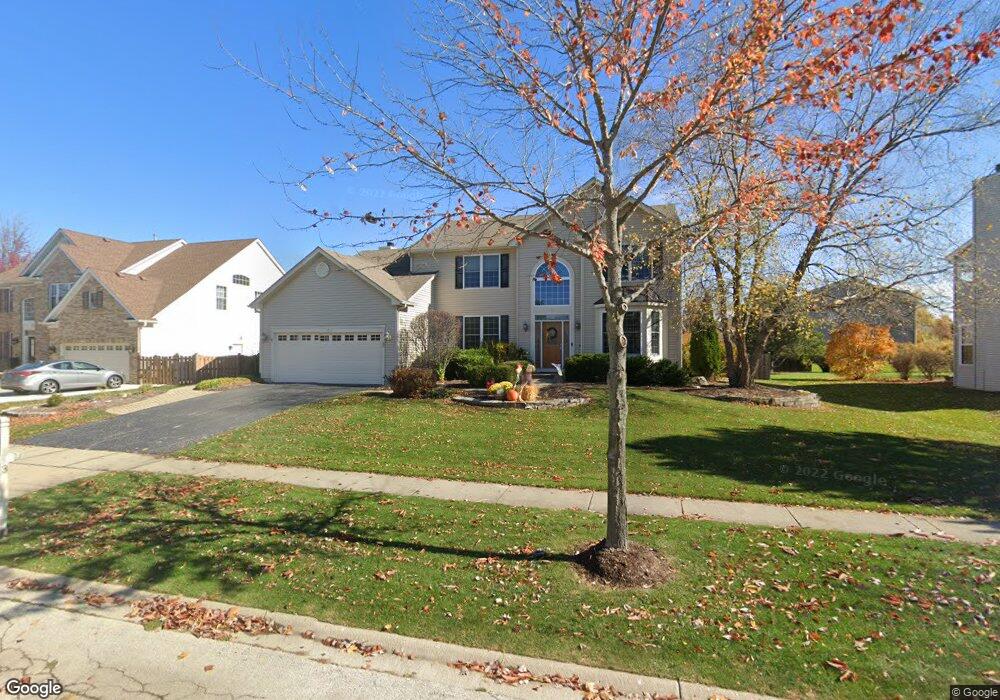
About This Home
This home is located at 3 Walbridge Ct, Algonquin, IL 60102 and is currently estimated at $533,754, approximately $175 per square foot. 3 Walbridge Ct is a home located in McHenry County with nearby schools including Mackeben Elementary School, Conley Elementary School, and Heineman Middle School.
Ownership History
We collect this data history from publicly available records. To have your information removed, we recommend requesting removal directly through your county’s website.
Purchase Details
Purchase Details
Home Financials for this Owner
Home Financials are based on the most recent Mortgage that was taken out on this home.Purchase Details
Home Financials for this Owner
Home Financials are based on the most recent Mortgage that was taken out on this home.Home Values in the Area
Average Home Value in this Area
Purchase History
We collect this data history from publicly available records. To have your information removed, we recommend requesting removal directly through your county’s website.
| Date | Buyer | Sale Price | Title Company |
|---|---|---|---|
| -- | None Listed On Document | ||
| $320,000 | -- | ||
| $243,000 | -- |
Mortgage History
We collect this data history from publicly available records. To have your information removed, we recommend requesting removal directly through your county’s website.
| Date | Status | Borrower | Loan Amount |
|---|---|---|---|
| Previous Owner | $288,000 | ||
| Previous Owner | $214,600 |
Tax History
We collect this data history from publicly available records. To have your information removed, we recommend requesting removal directly through your county’s website.
| Year | Tax Paid | Tax Assessment Tax Assessment Total Assessment is a certain percentage of the fair market value that is determined by local assessors to be the total taxable value of land and additions on the property. | Land | Improvement |
|---|---|---|---|---|
| 2024 | $10,558 | $151,500 | $17,702 | $133,798 |
| 2023 | $10,254 | $136,094 | $15,902 | $120,192 |
| 2022 | $9,752 | $123,925 | $14,480 | $109,445 |
| 2021 | $9,426 | $116,712 | $13,637 | $103,075 |
| 2020 | $9,286 | $113,599 | $13,273 | $100,326 |
| 2019 | $9,043 | $110,699 | $12,934 | $97,765 |
| 2018 | $10,187 | $121,184 | $14,556 | $106,628 |
| 2017 | $10,076 | $114,206 | $13,718 | $100,488 |
| 2016 | $10,170 | $108,581 | $13,042 | $95,539 |
| 2013 | -- | $104,588 | $15,664 | $88,924 |
Map
- 280 Prestwicke Blvd
- 4041 Whitehall Ln
- 4001 Whitehall Ln
- 8 Liam Ct
- 4211 Whitehall Ln
- 2 Tiverton Ct
- 23 Brixton Ct
- 9105 Algonquin Rd
- 3950 Coyote Lakes Cir
- 211 Ridge Ln
- 4053 Honeymoon Ridge
- 4740 Whitehall Ct
- 940 Treeline Dr
- 3960 Georgetown Cir
- 3621 Bunker Hill Dr
- 3250 Covington Ln
- 10 Covington Ct
- 12 Covington Ct
- 5 Covington Ct
- 3261 Covington Ln
- 14 Walbridge Ct
- 12 Walbridge Ct
- 16 Walbridge Ct
- 3983 W Algonquin Rd
- 3983 W Algonquin Rd
- 3973 W Algonquin Rd Unit 3973-3975
- 10 Walbridge Ct
- 18 Walbridge Ct
- 3965 W Algonquin Rd
- 5 Walbridge Ct
- 3923 W Algonquin Rd
- 3927 W Algonquin Rd
- 3927 W Algonquin Rd
- 8 Walbridge Ct
- 7 Walbridge Ct
- 20 Walbridge Ct
- 6 Walbridge Ct
- 11 Walbridge Ct
- 3907 W Algonquin Rd
- 3907 Algonquin Rd
Ask me questions while you tour the home.