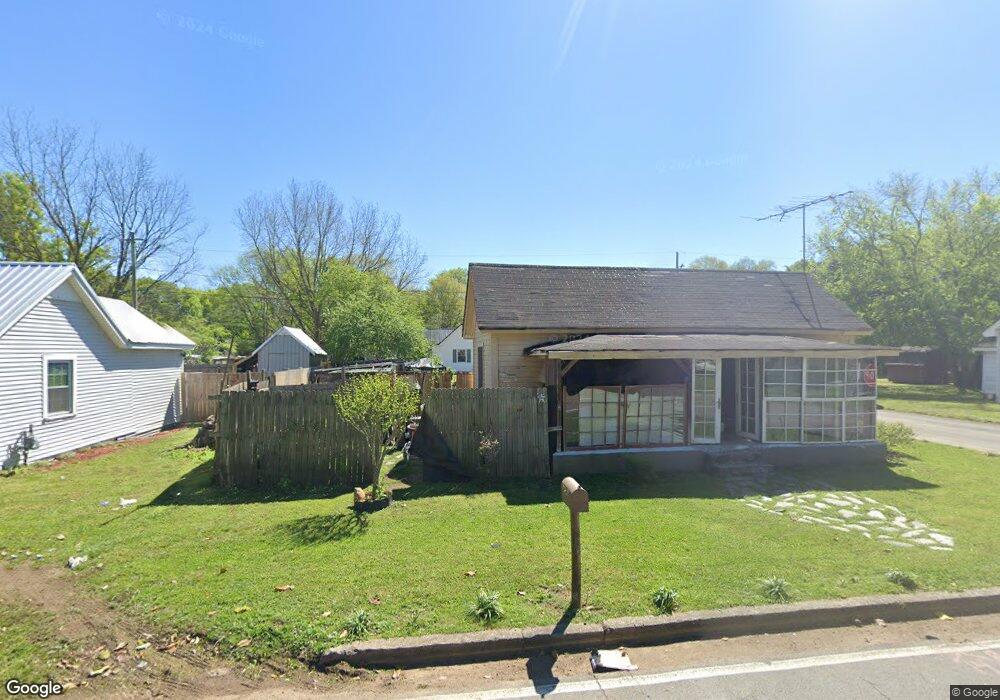
3 Walnut St Aragon, GA 30104
Estimated Value: $100,845 - $137,000
2
Beds
1
Bath
786
Sq Ft
$154/Sq Ft
Est. Value
About This Home
This home is located at 3 Walnut St, Aragon, GA 30104 and is currently estimated at $120,711, approximately $153 per square foot. 3 Walnut St is a home located in Polk County with nearby schools including Rockmart Middle School.
Ownership History
Date
Name
Owned For
Owner Type
Purchase Details
Closed on
Sep 11, 2025
Sold by
Hays Henley
Bought by
Hays Jeb
Current Estimated Value
Purchase Details
Closed on
Sep 8, 2017
Sold by
Hutcheson Dondra J
Bought by
Hayes Deion
Purchase Details
Closed on
Oct 1, 2014
Sold by
Henderson Henry D
Bought by
Hutcheson Dondra
Purchase Details
Closed on
Nov 1, 2013
Sold by
Hutcheson Dondra
Bought by
Henderson Henry D
Home Financials for this Owner
Home Financials are based on the most recent Mortgage that was taken out on this home.
Original Mortgage
$10,000
Interest Rate
4.23%
Mortgage Type
New Conventional
Purchase Details
Closed on
Feb 4, 2011
Sold by
Robinson Doress**
Bought by
Hutcheson Dondra *
Purchase Details
Closed on
Feb 8, 2010
Sold by
Robinson Doress *M and Robinson P
Bought by
Hutcheson Dondra
Purchase Details
Closed on
Mar 22, 1966
Sold by
Roberson James P
Bought by
Robinson Roland H
Purchase Details
Closed on
Jan 1, 1964
Sold by
Carpenter Chas F
Bought by
Roberson James P
Purchase Details
Closed on
Aug 6, 1960
Bought by
Carpenter Chas F
Create a Home Valuation Report for This Property
The Home Valuation Report is an in-depth analysis detailing your home's value as well as a comparison with similar homes in the area
Purchase History
| Date | Buyer | Sale Price | Title Company |
|---|---|---|---|
| Hays Jeb | -- | -- | |
| Hayes Deion | $1,000 | -- | |
| Hutcheson Dondra | -- | -- | |
| Henderson Henry D | $10,000 | -- | |
| Hutcheson Dondra * | -- | -- | |
| Hutcheson Dondra | -- | -- | |
| Robinson Roland H | -- | -- | |
| Roberson James P | -- | -- | |
| Carpenter Chas F | -- | -- |
Source: Public Records
Mortgage History
| Date | Status | Borrower | Loan Amount |
|---|---|---|---|
| Previous Owner | Henderson Henry D | $10,000 |
Source: Public Records
Tax History
| Year | Tax Paid | Tax Assessment Tax Assessment Total Assessment is a certain percentage of the fair market value that is determined by local assessors to be the total taxable value of land and additions on the property. | Land | Improvement |
|---|---|---|---|---|
| 2025 | $684 | $23,588 | $8,000 | $15,588 |
| 2024 | $676 | $23,587 | $8,000 | $15,587 |
| 2023 | $290 | $8,868 | $560 | $8,308 |
| 2022 | $181 | $7,644 | $560 | $7,084 |
| 2021 | $184 | $7,644 | $560 | $7,084 |
| 2020 | $184 | $7,644 | $560 | $7,084 |
| 2019 | $119 | $4,445 | $1,342 | $3,103 |
| 2018 | $120 | $4,344 | $1,342 | $3,002 |
| 2017 | $118 | $4,344 | $1,342 | $3,002 |
| 2016 | $118 | $4,344 | $1,342 | $3,002 |
| 2015 | $120 | $4,409 | $1,342 | $3,067 |
| 2014 | $110 | $4,111 | $1,103 | $3,008 |
Source: Public Records
Map
Nearby Homes
- 30 Oak St
- 19 Walnut St
- 34 Elm St
- 28 Walnut St
- 15 Aragon Rd
- 54 Taylorsville Rd
- 0 Rome Hwy 101 Unit 10445422
- 3 Magnolia St
- 5 Magnolia St
- 11 Magnolia St
- 65 Long Station Rd
- 1638 Prospect Rd
- 70 N Bellview Rd
- 156 Dogwood Glen Dr
- 88 N Bellview Rd
- 2300 Frettiesburg Dr
- 94 Eastwood Path
- 133 N Bellview Rd
- 62 Morgan Rd
- 95 Cashtown Rd
Your Personal Tour Guide
Ask me questions while you tour the home.