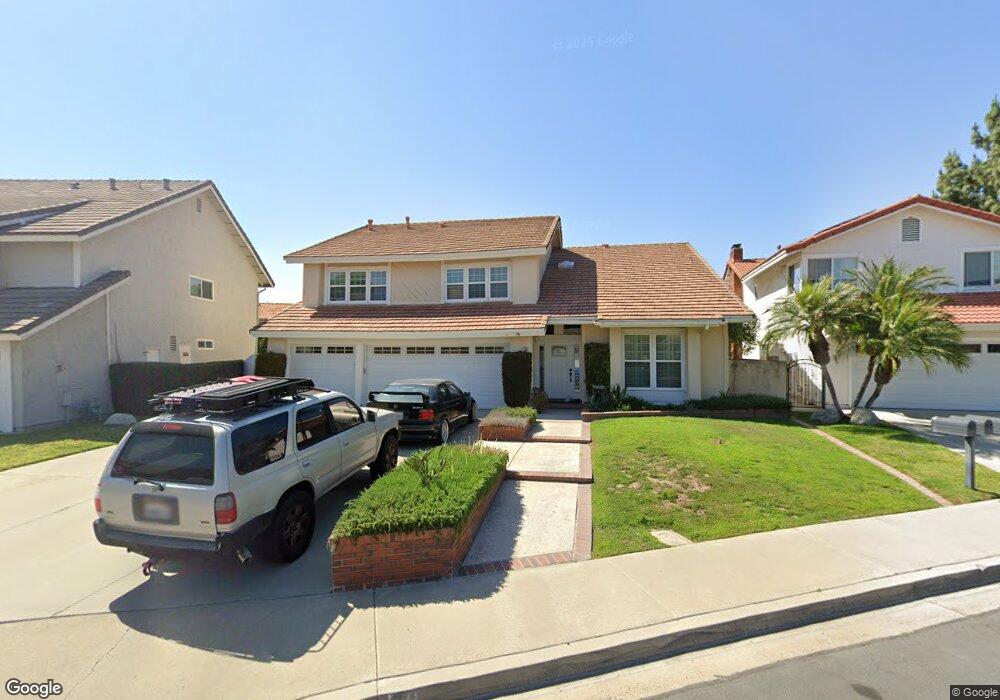
3 Winchester Irvine, CA 92620
Northwood NeighborhoodEstimated Value: $2,079,379 - $2,321,000
4
Beds
3
Baths
2,925
Sq Ft
$757/Sq Ft
Est. Value
About This Home
This home is located at 3 Winchester, Irvine, CA 92620 and is currently estimated at $2,215,595, approximately $757 per square foot. 3 Winchester is a home located in Orange County with nearby schools including Brywood Elementary School, Sierra Vista Middle School, and Northwood High School.
Ownership History
Date
Name
Owned For
Owner Type
Purchase Details
Closed on
Sep 11, 2020
Sold by
Hsieh Cinthia Kush Brian and Hsieh George
Bought by
Hsieh Property Holdings Llc
Current Estimated Value
Purchase Details
Closed on
Aug 7, 2019
Sold by
Hsieh Yieh Nien
Bought by
Hsieh Stephen and Hsieh Family Trust
Purchase Details
Closed on
Mar 19, 2015
Sold by
Hsieh Yieh Nien
Bought by
Hsieh Yieh Nien
Create a Home Valuation Report for This Property
The Home Valuation Report is an in-depth analysis detailing your home's value as well as a comparison with similar homes in the area
Home Values in the Area
Average Home Value in this Area
Purchase History
| Date | Buyer | Sale Price | Title Company |
|---|---|---|---|
| Hsieh Property Holdings Llc | -- | None Available | |
| Hsieh Stephen | -- | None Available | |
| Hsieh Yieh Nien | -- | Pacific Coast Title Company | |
| Hsieh Yieh Nien | -- | Pacific Coast Title Company |
Source: Public Records
Tax History Compared to Growth
Tax History
| Year | Tax Paid | Tax Assessment Tax Assessment Total Assessment is a certain percentage of the fair market value that is determined by local assessors to be the total taxable value of land and additions on the property. | Land | Improvement |
|---|---|---|---|---|
| 2025 | $7,073 | $675,503 | $398,837 | $276,666 |
| 2024 | $7,073 | $662,258 | $391,016 | $271,242 |
| 2023 | $6,890 | $649,273 | $383,349 | $265,924 |
| 2022 | $6,759 | $636,543 | $375,833 | $260,710 |
| 2021 | $6,604 | $624,062 | $368,463 | $255,599 |
| 2020 | $6,567 | $617,664 | $364,685 | $252,979 |
| 2019 | $6,422 | $605,553 | $357,534 | $248,019 |
| 2018 | $6,309 | $593,680 | $350,524 | $243,156 |
| 2017 | $6,179 | $582,040 | $343,651 | $238,389 |
| 2016 | $5,836 | $570,628 | $336,913 | $233,715 |
| 2015 | $5,748 | $562,057 | $331,852 | $230,205 |
| 2014 | $5,636 | $551,048 | $325,352 | $225,696 |
Source: Public Records
Map
Nearby Homes