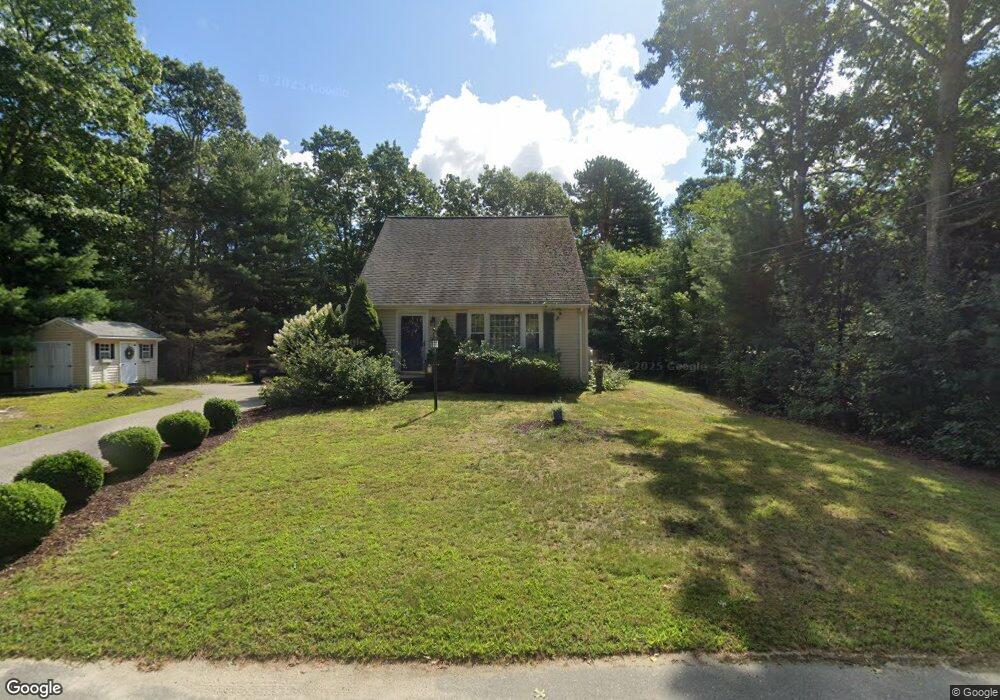
3 Winslow Ln Wareham, MA 02571
Weweantic NeighborhoodEstimated Value: $428,000 - $491,000
2
Beds
2
Baths
962
Sq Ft
$482/Sq Ft
Est. Value
About This Home
This home is located at 3 Winslow Ln, Wareham, MA 02571 and is currently estimated at $463,685, approximately $482 per square foot. 3 Winslow Ln is a home located in Plymouth County with nearby schools including Tabor Academy.
Ownership History
Date
Name
Owned For
Owner Type
Purchase Details
Closed on
Sep 16, 2009
Sold by
Cardoza Brian G
Bought by
Lomeland Luke and Lomeland Patricia M
Current Estimated Value
Purchase Details
Closed on
Jun 18, 2002
Sold by
Franchi Margaret G
Bought by
Cardoza Brian G and Reppucci Gina M
Create a Home Valuation Report for This Property
The Home Valuation Report is an in-depth analysis detailing your home's value as well as a comparison with similar homes in the area
Home Values in the Area
Average Home Value in this Area
Purchase History
| Date | Buyer | Sale Price | Title Company |
|---|---|---|---|
| Lomeland Luke | $210,000 | -- | |
| Lomeland Luke | $210,000 | -- | |
| Cardoza Brian G | $218,000 | -- | |
| Cardoza Brian G | $218,000 | -- |
Source: Public Records
Mortgage History
| Date | Status | Borrower | Loan Amount |
|---|---|---|---|
| Open | Cardoza Brian G | $50,000 | |
| Closed | Cardoza Brian G | $10,000 | |
| Previous Owner | Cardoza Brian G | $184,000 |
Source: Public Records
Tax History
| Year | Tax Paid | Tax Assessment Tax Assessment Total Assessment is a certain percentage of the fair market value that is determined by local assessors to be the total taxable value of land and additions on the property. | Land | Improvement |
|---|---|---|---|---|
| 2025 | $3,725 | $357,500 | $128,000 | $229,500 |
| 2024 | $3,827 | $340,800 | $100,500 | $240,300 |
| 2023 | $3,400 | $302,700 | $91,300 | $211,400 |
| 2022 | $3,400 | $258,000 | $91,300 | $166,700 |
| 2021 | $3,364 | $250,100 | $91,300 | $158,800 |
| 2020 | $3,213 | $242,300 | $91,300 | $151,000 |
| 2019 | $3,095 | $232,900 | $89,800 | $143,100 |
| 2018 | $2,830 | $207,600 | $89,800 | $117,800 |
| 2017 | $2,726 | $202,700 | $89,800 | $112,900 |
| 2016 | $2,577 | $190,500 | $85,100 | $105,400 |
| 2015 | $2,490 | $190,500 | $85,100 | $105,400 |
| 2014 | $2,544 | $198,000 | $92,800 | $105,200 |
Source: Public Records
Map
Nearby Homes
- 14 Briarwood Dr
- 12 Taft St
- 9 Woodville Way
- 4 Roosevelt St
- 58 Shady Ln
- 15 14th Ave
- 0 Cromesett Rd (Off) Unit 73385395
- 233 Marion Rd
- 21 Bayview St
- 6 Wildwood Ave
- 10 Barnes St
- 20 Grant St
- 43 Shore Ave
- 15 Broadmarsh Ave
- 6 Allen Ave
- 6 Bourne Terrace
- 10 Longmeadow Dr
- 929 Point Rd
- 1 Nimrod Way
- 0 Cross Neck Rd Unit 73420524
Your Personal Tour Guide
Ask me questions while you tour the home.