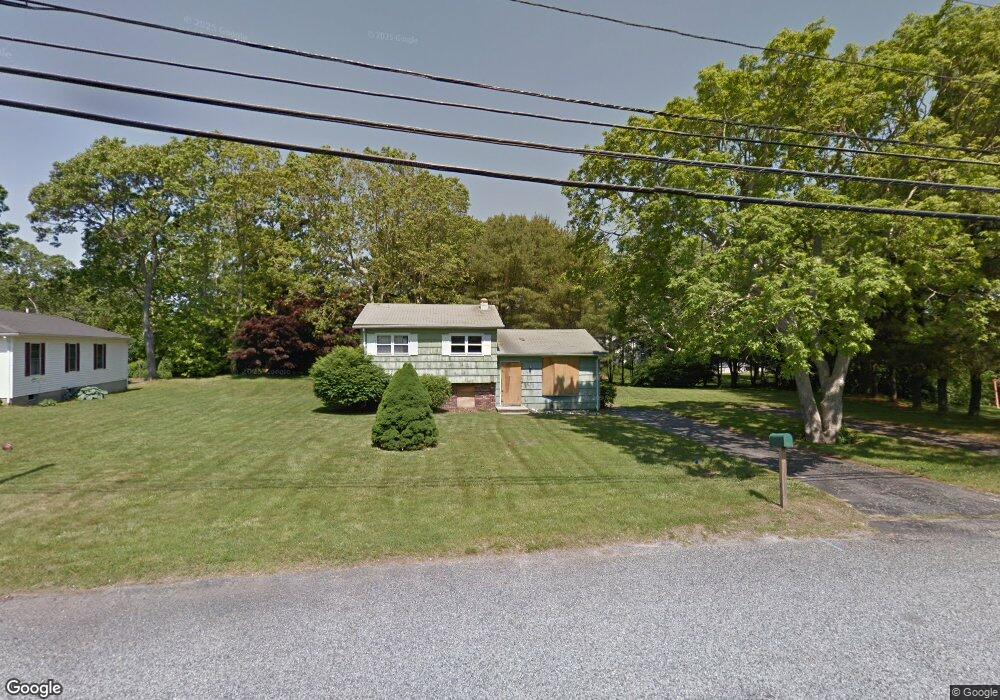
3 Wompag Rd Westerly, RI 02891
Estimated Value: $564,028 - $696,000
2
Beds
2
Baths
1,416
Sq Ft
$435/Sq Ft
Est. Value
About This Home
This home is located at 3 Wompag Rd, Westerly, RI 02891 and is currently estimated at $615,757, approximately $434 per square foot. 3 Wompag Rd is a home located in Washington County with nearby schools including Westerly High School.
Ownership History
Date
Name
Owned For
Owner Type
Purchase Details
Closed on
Jul 18, 2016
Sold by
Nesmith Joyce M
Bought by
Nesmith Danny and Nesmith Joyce
Current Estimated Value
Purchase Details
Closed on
Apr 9, 2001
Sold by
Young Geoge T and Young Carole M
Bought by
Nesmith Danny M and Nesmith Joyce M
Create a Home Valuation Report for This Property
The Home Valuation Report is an in-depth analysis detailing your home's value as well as a comparison with similar homes in the area
Home Values in the Area
Average Home Value in this Area
Purchase History
| Date | Buyer | Sale Price | Title Company |
|---|---|---|---|
| Nesmith Danny | -- | -- | |
| Nesmith Danny M | $151,000 | -- |
Source: Public Records
Mortgage History
| Date | Status | Borrower | Loan Amount |
|---|---|---|---|
| Previous Owner | Nesmith Danny M | $170,000 | |
| Previous Owner | Nesmith Danny M | $110,000 | |
| Previous Owner | Nesmith Danny M | $60,000 |
Source: Public Records
Tax History
| Year | Tax Paid | Tax Assessment Tax Assessment Total Assessment is a certain percentage of the fair market value that is determined by local assessors to be the total taxable value of land and additions on the property. | Land | Improvement |
|---|---|---|---|---|
| 2025 | $3,222 | $453,200 | $186,100 | $267,100 |
| 2024 | $3,268 | $333,100 | $132,900 | $200,200 |
| 2023 | $3,204 | $333,100 | $132,900 | $200,200 |
| 2022 | $3,184 | $333,100 | $132,900 | $200,200 |
| 2021 | $3,040 | $263,900 | $115,500 | $148,400 |
| 2020 | $2,985 | $263,900 | $115,500 | $148,400 |
| 2019 | $2,956 | $263,900 | $115,500 | $148,400 |
| 2018 | $2,864 | $241,100 | $115,500 | $125,600 |
| 2017 | $2,731 | $235,600 | $115,500 | $120,100 |
| 2016 | $2,752 | $235,600 | $115,500 | $120,100 |
| 2015 | $2,757 | $254,800 | $123,600 | $131,200 |
| 2014 | $2,352 | $254,800 | $123,600 | $131,200 |
Source: Public Records
Map
Nearby Homes
- 5 Robin Hollow Ln
- 35 Robin Hollow Ln
- 30 Clifford Dr
- 342 Post Rd
- 26 Charlene Ave
- 13 Plateau Rd
- 346 Post Rd
- 43 Noyes Neck Rd
- 20 Snowberry Ln
- 22 Breach Dr
- 6 Verdi Rd
- 118 Dunns Corner Rd
- 54 Sherwood Dr
- 470 Atlantic Ave
- 5 Fletcher Dr
- 19 Wicklow Rd
- 446 Atlantic Ave
- 432 Atlantic Ave
- 5259 Old Post Rd
- 135 Ross Hill Rd
Your Personal Tour Guide
Ask me questions while you tour the home.