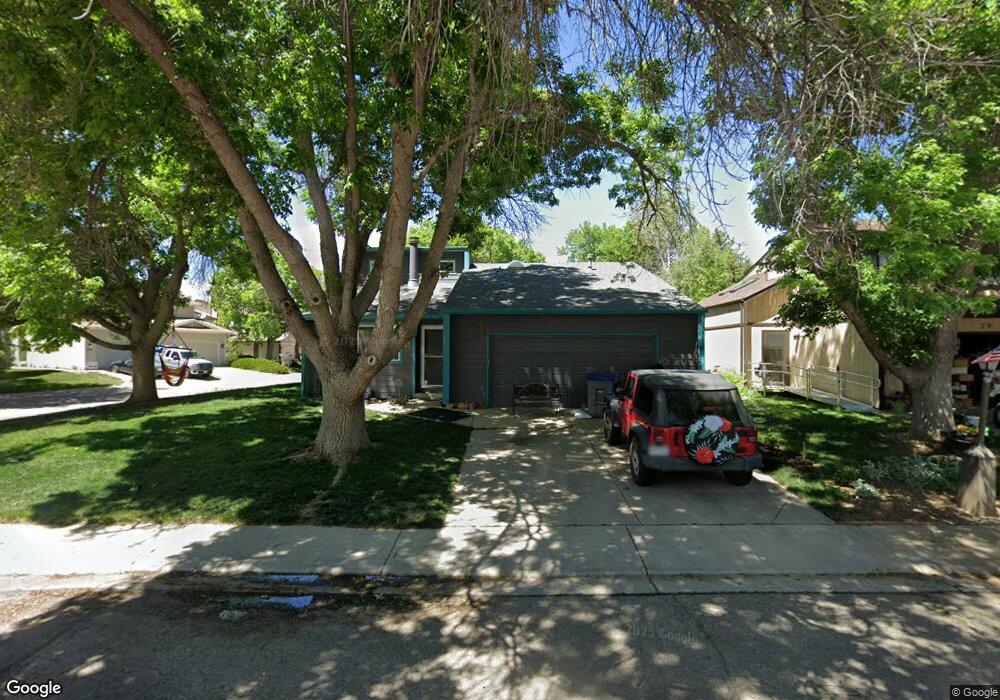
30 12th Ave Longmont, CO 80501
Clark Centennial NeighborhoodEstimated Value: $342,000 - $449,000
2
Beds
1
Bath
1,324
Sq Ft
$299/Sq Ft
Est. Value
About This Home
This home is located at 30 12th Ave, Longmont, CO 80501 and is currently estimated at $396,203, approximately $299 per square foot. 30 12th Ave is a home located in Boulder County with nearby schools including Columbine Elementary School, Trail Ridge Middle School, and Skyline High School.
Ownership History
Date
Name
Owned For
Owner Type
Purchase Details
Closed on
Jul 7, 2008
Sold by
Citicorp Trust Bank Fsb
Bought by
Owens Autumn Sky
Current Estimated Value
Home Financials for this Owner
Home Financials are based on the most recent Mortgage that was taken out on this home.
Original Mortgage
$99,926
Interest Rate
6.29%
Mortgage Type
FHA
Purchase Details
Closed on
Feb 1, 2008
Sold by
Manzanares Arthur E and Manzanares Patricia A
Bought by
Citicorp Trust Bank Fsb
Purchase Details
Closed on
Feb 26, 1999
Sold by
Kielian Dorothy K and Kielian Dorothy G
Bought by
Manzanares Arthur E
Home Financials for this Owner
Home Financials are based on the most recent Mortgage that was taken out on this home.
Original Mortgage
$126,000
Interest Rate
6.8%
Purchase Details
Closed on
Apr 21, 1992
Bought by
Owens Autumn Sky
Purchase Details
Closed on
Apr 3, 1992
Bought by
Owens Autumn Sky
Purchase Details
Closed on
Jan 11, 1982
Bought by
Owens Autumn Sky
Create a Home Valuation Report for This Property
The Home Valuation Report is an in-depth analysis detailing your home's value as well as a comparison with similar homes in the area
Home Values in the Area
Average Home Value in this Area
Purchase History
| Date | Buyer | Sale Price | Title Company |
|---|---|---|---|
| Owens Autumn Sky | $101,500 | Fahtco | |
| Citicorp Trust Bank Fsb | -- | None Available | |
| Manzanares Arthur E | $129,900 | -- | |
| Owens Autumn Sky | -- | -- | |
| Owens Autumn Sky | -- | -- | |
| Owens Autumn Sky | $66,700 | -- |
Source: Public Records
Mortgage History
| Date | Status | Borrower | Loan Amount |
|---|---|---|---|
| Previous Owner | Owens Autumn Sky | $99,926 | |
| Previous Owner | Manzanares Arthur E | $126,000 |
Source: Public Records
Tax History Compared to Growth
Tax History
| Year | Tax Paid | Tax Assessment Tax Assessment Total Assessment is a certain percentage of the fair market value that is determined by local assessors to be the total taxable value of land and additions on the property. | Land | Improvement |
|---|---|---|---|---|
| 2025 | $1,896 | $25,213 | $6,469 | $18,744 |
| 2024 | $1,896 | $25,213 | $6,469 | $18,744 |
| 2023 | $1,870 | $19,819 | $7,089 | $16,415 |
| 2022 | $1,770 | $17,889 | $5,129 | $12,760 |
| 2021 | $1,793 | $18,404 | $5,277 | $13,127 |
| 2020 | $1,902 | $19,584 | $5,148 | $14,436 |
| 2019 | $1,872 | $19,584 | $5,148 | $14,436 |
| 2018 | $1,482 | $15,602 | $5,112 | $10,490 |
| 2017 | $1,462 | $17,250 | $5,652 | $11,598 |
| 2016 | $1,229 | $12,855 | $4,776 | $8,079 |
| 2015 | $1,171 | $11,884 | $3,741 | $8,143 |
| 2014 | $1,110 | $11,884 | $3,741 | $8,143 |
Source: Public Records
Map
Nearby Homes
- 1211 Meadow St
- 1226 Atwood St
- 107 Caribou Place
- 1147 Emery St
- 10 Juneau Place
- 1501 Liberty Ct
- 147 Dawson Place
- 1430 Lashley St
- 845 Martin St
- 117 Valentine Ln
- 1514 Collyer St
- 342 9th Ave
- 936 Kimbark St Unit 4
- 836 Emery St
- 823 Collyer St
- 830 Emery St
- 50 Forsyth Dr
- 1310 Hilltop Dr
- 727 Baker St
- 1455 Hilltop Dr